
Two simple steps = 15% more production line throughput. How is this possible? See how we managed to optimize the process at Garne.
Garne is a Ukrainian manufacturer of high-quality clothing, and our implementation focused on their t-shirt production line, a fast-rotating product known as a “high runner”.
The company believed their process was balanced, with all stations set up to have similar cycle times, which should ensure smooth flow. Through the implementation of KanriSoft, Garne not only verified whether reality matched their assumptions but also found room for improvement without incurring additional costs.
Contents
Assumptions
The production line at Garne consists of six machines, configured into 5 workstations as shown in the block diagram. The first two machines at the beginning of the line form the first station operated by one operator, the next two work in parallel due to longer cycle time at this stage, and the final two work in series one after another.
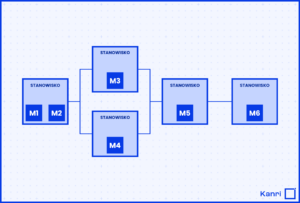
In theory, the sum of times for the first two machines was supposed to be close to the average time of the next two parallel ones, and approximately equal to the times of the last two. This is illustrated in the figure below.
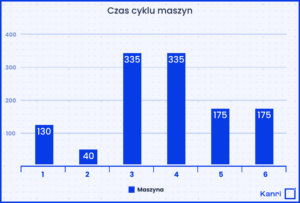
After considering the line configuration, we should achieve a fairly balanced process because:
- times of the first two operations should be summed (one workstation)
- times of the next two should be averaged (parallel work)
This should result in a Yamazumi chart for this process as shown in the figure below:
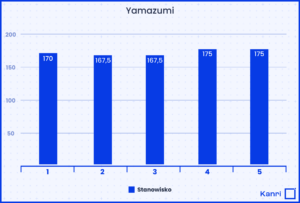
Theoretically, during an 8-hour shift, the line could produce 165 t-shirts (assuming an ideal scenario without any breaks). However, accounting for breaks and assuming an OEE of 85% of theoretical, we get 140 pieces of finished product that the line can produce during a shift.
Reality
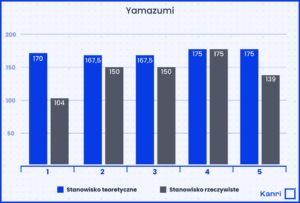
After installing Kanri and measuring actual results, it turned out that:
- Time at station 1 is 104 seconds
- Time at stations 2 and 3 is 150 seconds
- Time at station 4 is 175 seconds
- Time at station 5 is 139 seconds
This is illustrated in the graph below:
Improvement
From the theory of constraints, we know that a line will only be as fast as its slowest resource (bottleneck). Hence the previous result:
- 8h(shift)*85%(efficiency)*60(minutes)*60(seconds)/175(seconds slowest machine)=140 pcs.
What could it be? What if we could reduce the load on machine 4? The bottleneck could move to machines 2 and 3, and then:
- 8h(shift)85%(efficiency)*60(minutes)*60(seconds)/150(seconds slowest machine)=163 pcs.
163/140*100%=116%
Worth it? Of course, but how to do it?
Machine 1 at station 1 is actually identical to machine 4. Since machine 1 has excess capacity, we just need to make it help. How to achieve this?
It was enough to introduce two small changes in work organization. Until now, the client created production orders for 1000 pieces. Neither a multiple of 140 nor a week’s plan. So we suggested changing the order size to 163 pieces. Thanks to this, the operator at station 1 can perfectly catch the moment when they should finish their operation and start helping machine 5. The second change is precisely that operator 1 performs not one but two operations. After achieving the goal of 163 pieces, which takes:
- 104(seconds)*163(pieces)/60(minutes)*60(seconds)*85%(efficiency)=5.5h, they have 3.5h available, so:
- 3.5(hours)*60(minutes)*60(seconds)*85%(efficiency)/175(seconds of operation 4)=61 additional t-shirts. And we only need 23 more to reach the new goal of 163 pieces.
Why only that much? Because the bottleneck moved to machines 3 and 4, but we don’t have those duplicated, so for now the bottleneck must stay there. Machine 1 still has excess capacity that we can’t consume in the current configuration, however, the 16% increase in overall line efficiency seems satisfactory for a first process improvement attempt, especially since it was achieved without any additional investment, just by measuring actual data and reorganizing work.
Summary
The implementation of KanriSoft at Garne demonstrated how detailed analysis of production data and simple changes in work organization can achieve significant improvements without incurring additional costs. Changes in machine operation and process optimization allowed for a 16% increase in production throughput, resulting in greater efficiency and better resource utilization. This is an excellent example of how digital technologies can improve production efficiency.
Want to learn how KanriSoft can help optimize processes in your company? Contact us and discover opportunities to improve efficiency without additional costs!