

KANRI FOR SUPERVISOR
Kanri's Supervisor Dashboard provides complete production line management and real-time performance tracking
Explore the capabilities of the Supervisor Panel
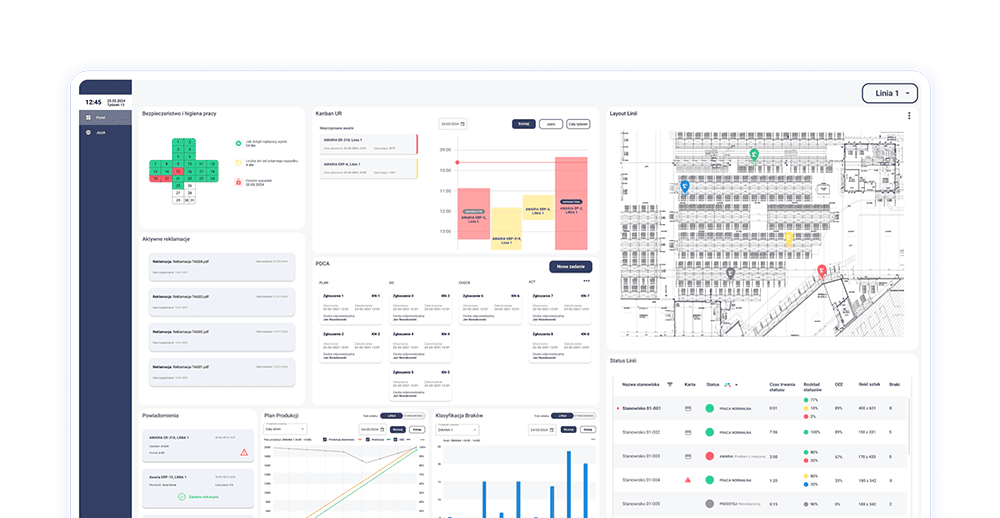
The Supervisor Panel delivers a comprehensive overview of all production processes in one centralized, intuitive interface. It's an essential tool for effective management and seamless communication between supervisors and operators.
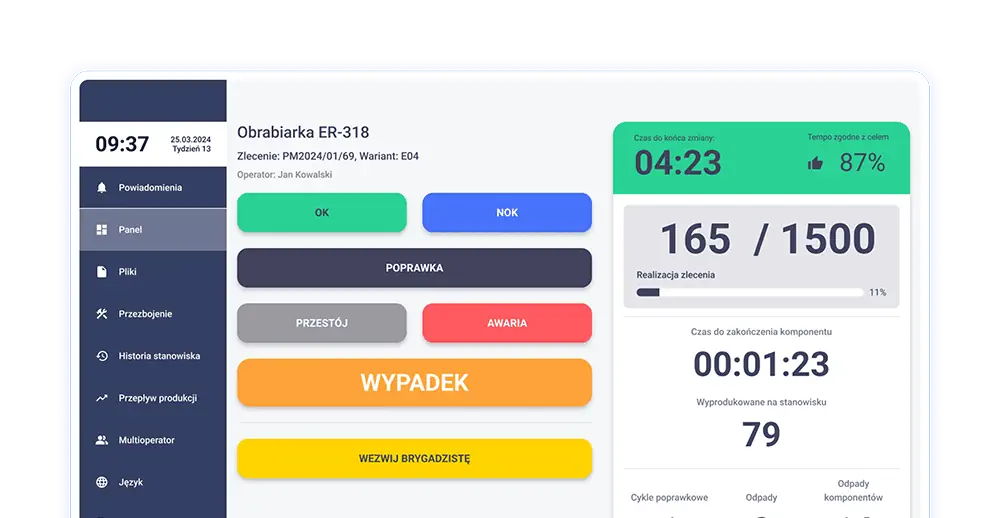
Work order management
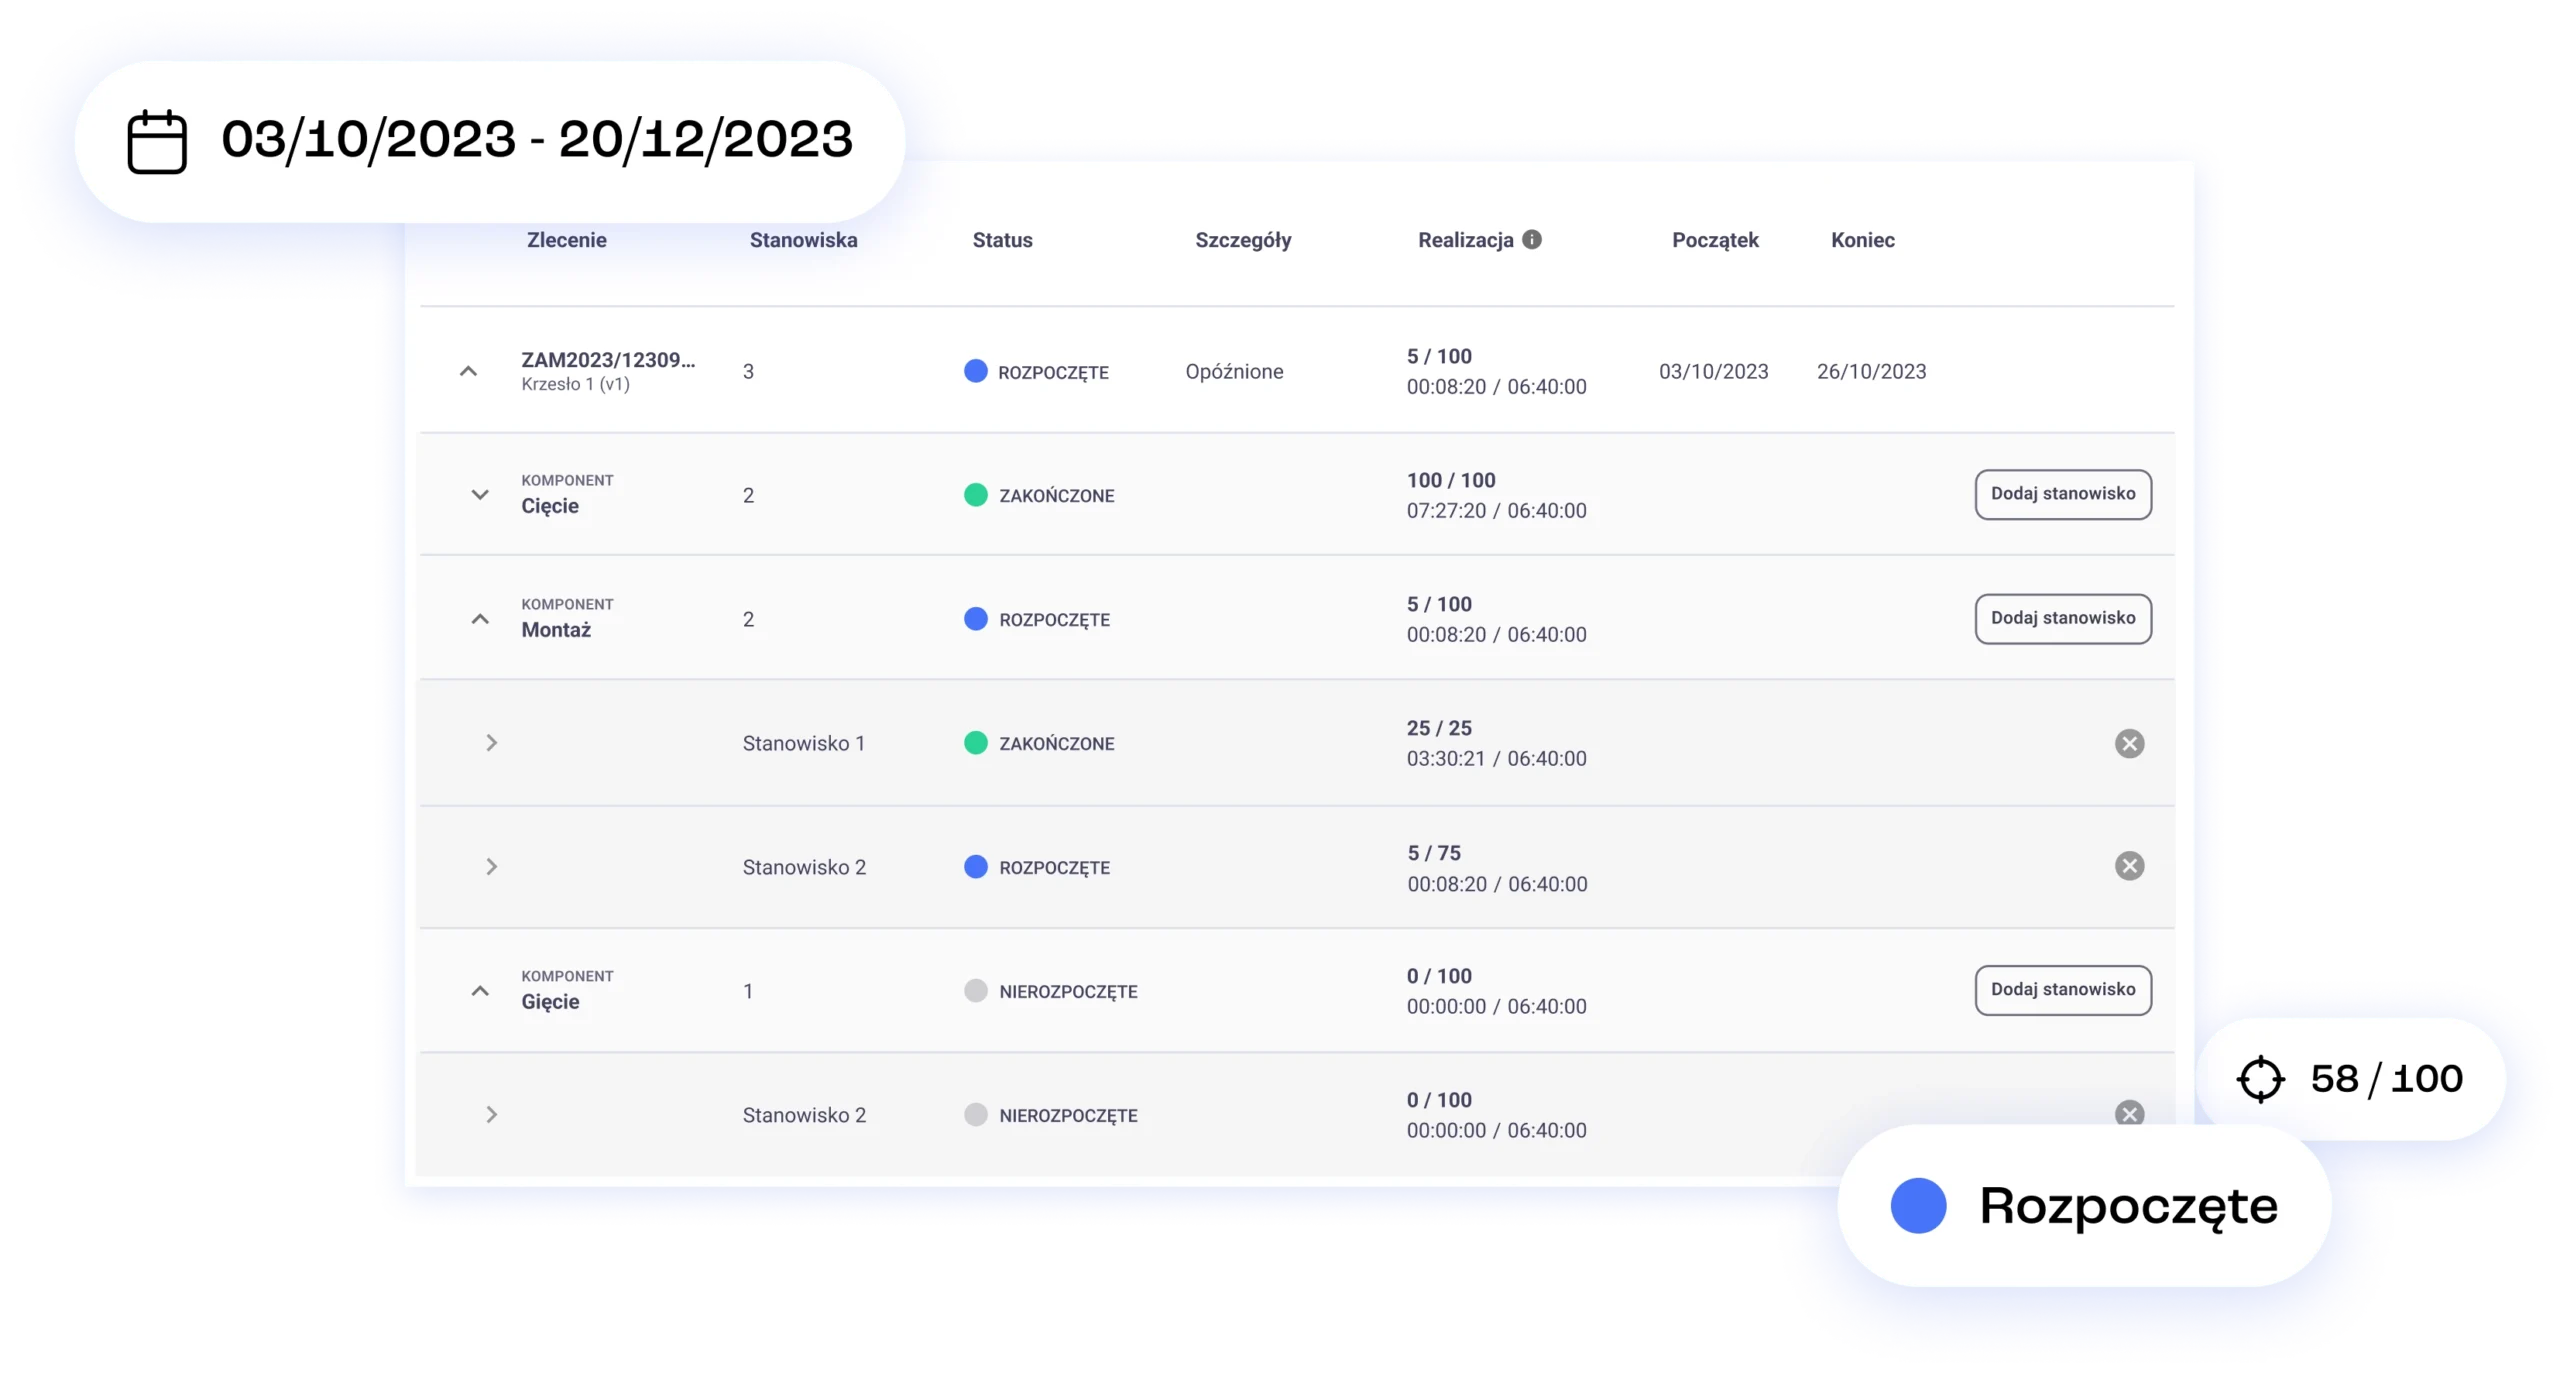
Work orders drive your production process. As a supervisor, you maintain complete visibility into order status and progress.
Through your dashboard, you can add or remove stations from specific orders, with changes instantly communicated to operators.
Real-Time Line Monitoring
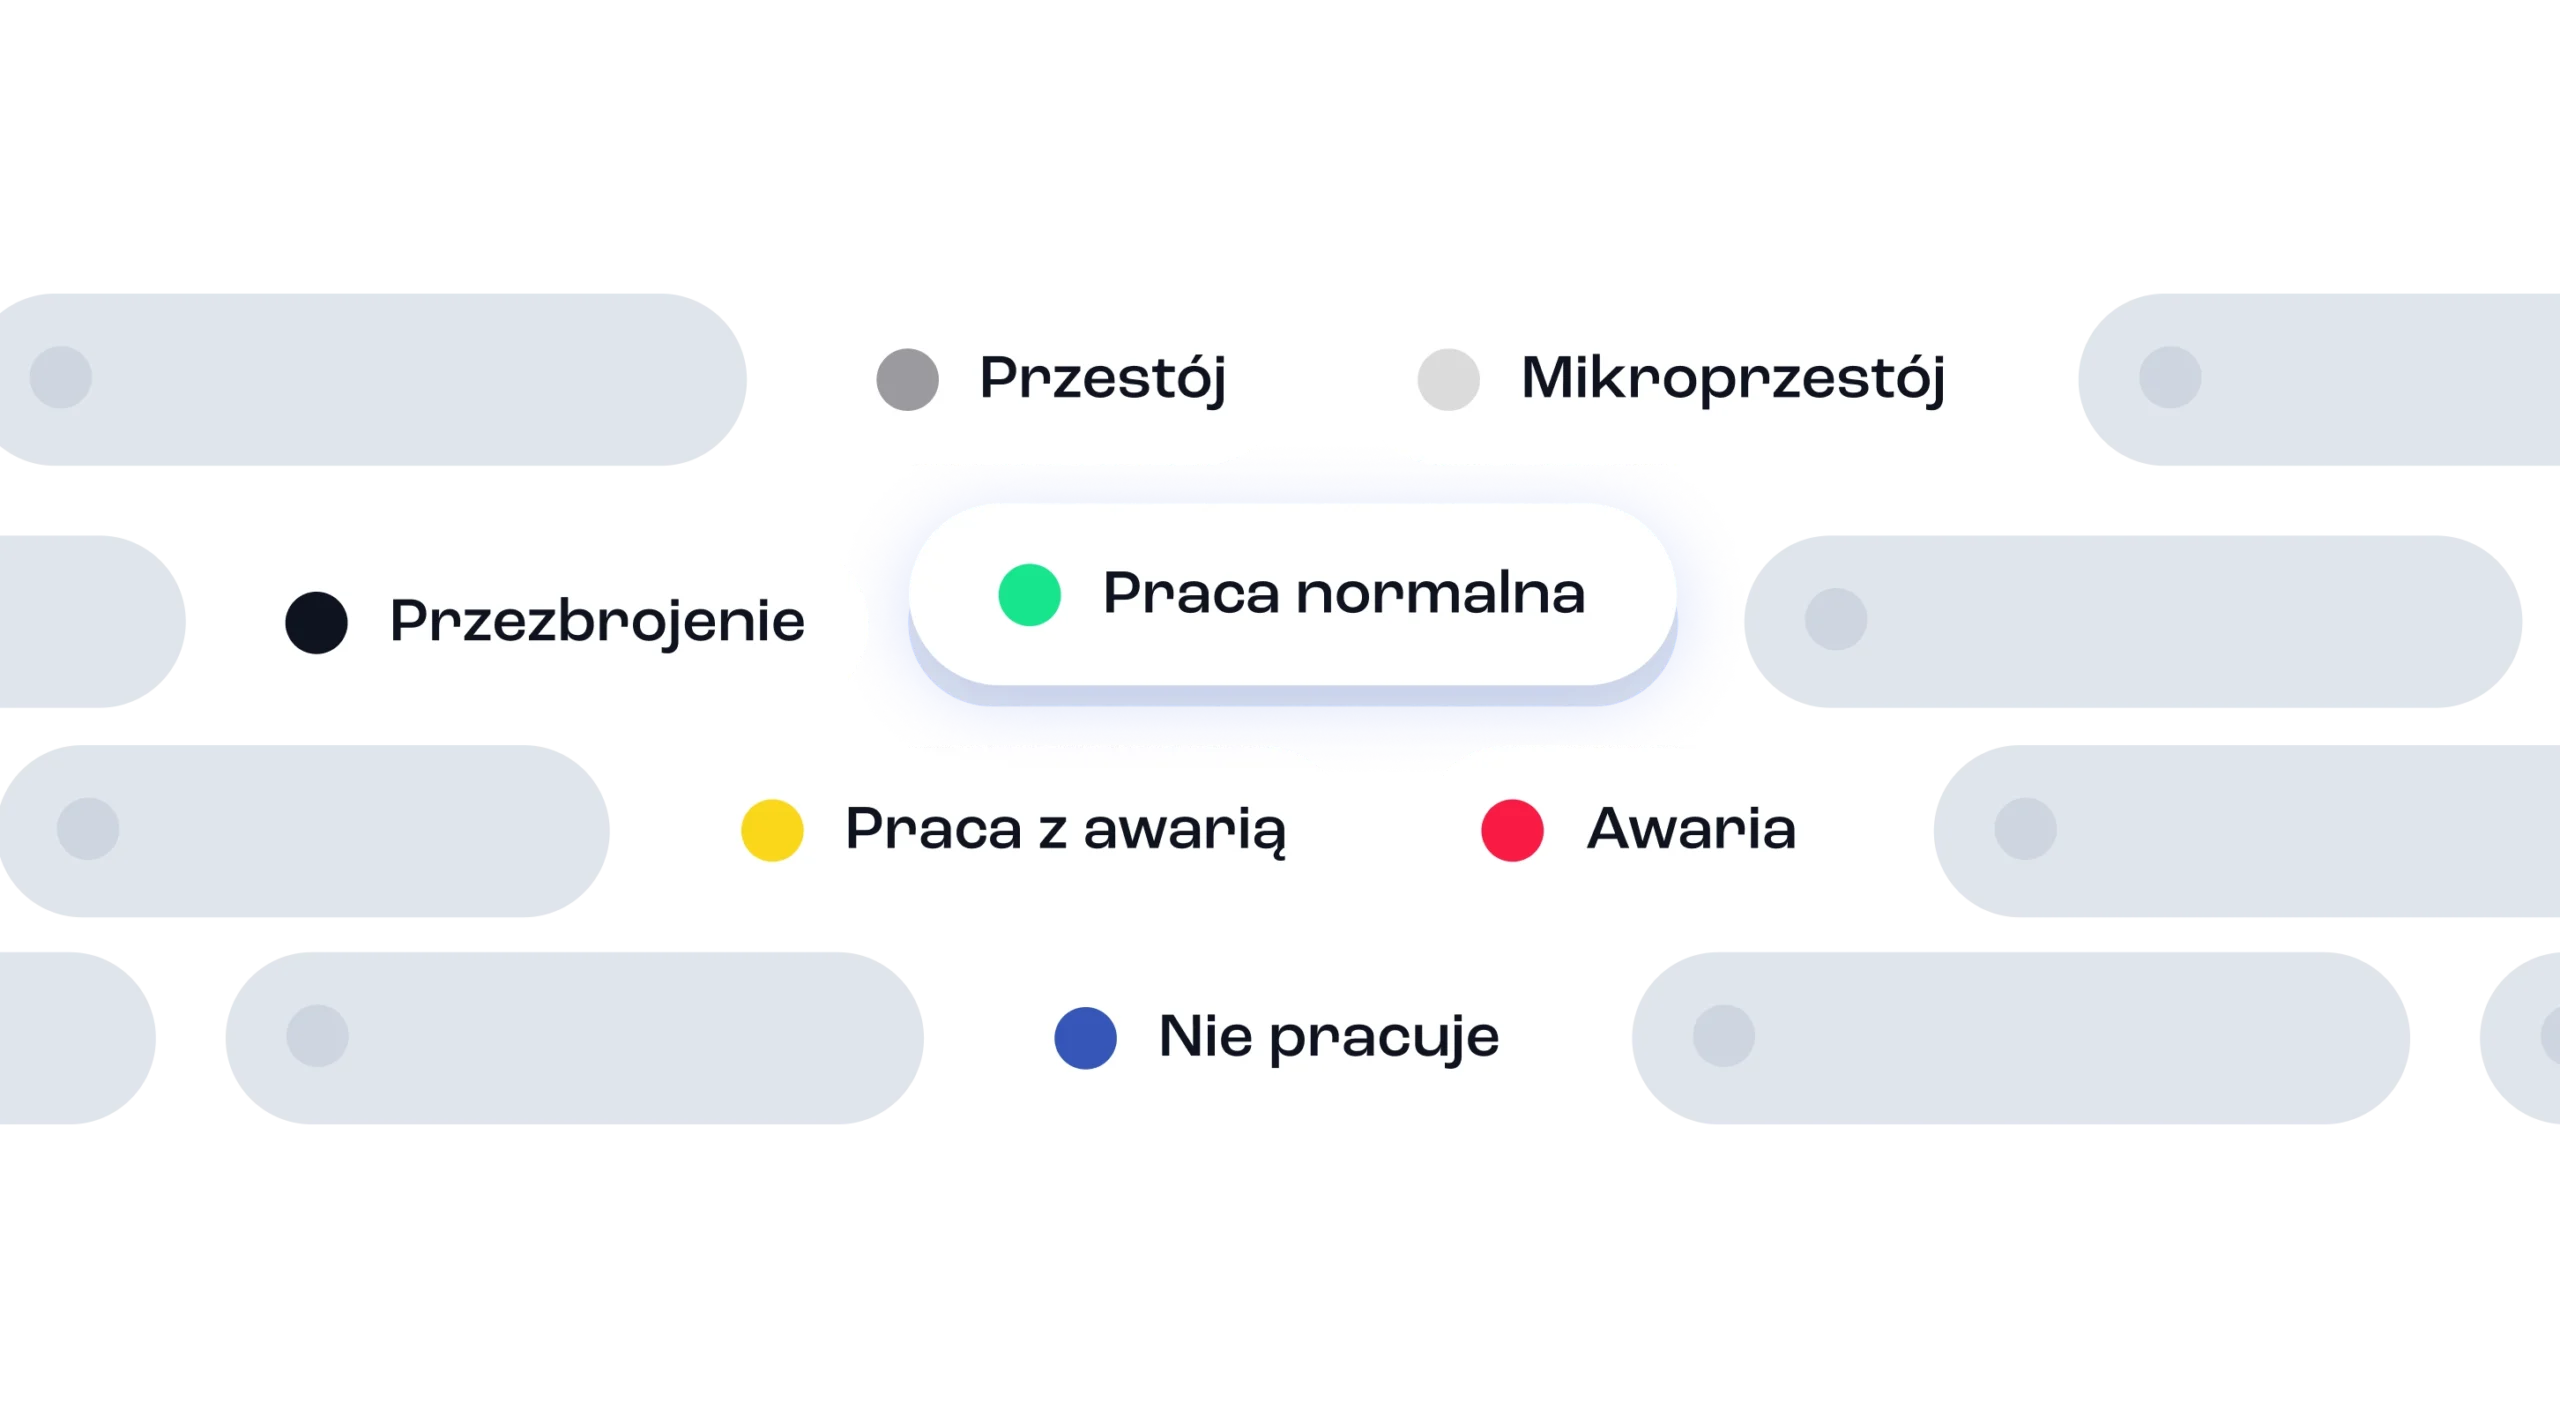
Monitor events and work progress across all stations on your line. Access real-time information including:
- Current station status: normal operation, downtime, breakdown, changeover, maintenance
- Job details: active orders, product variants, assigned operators
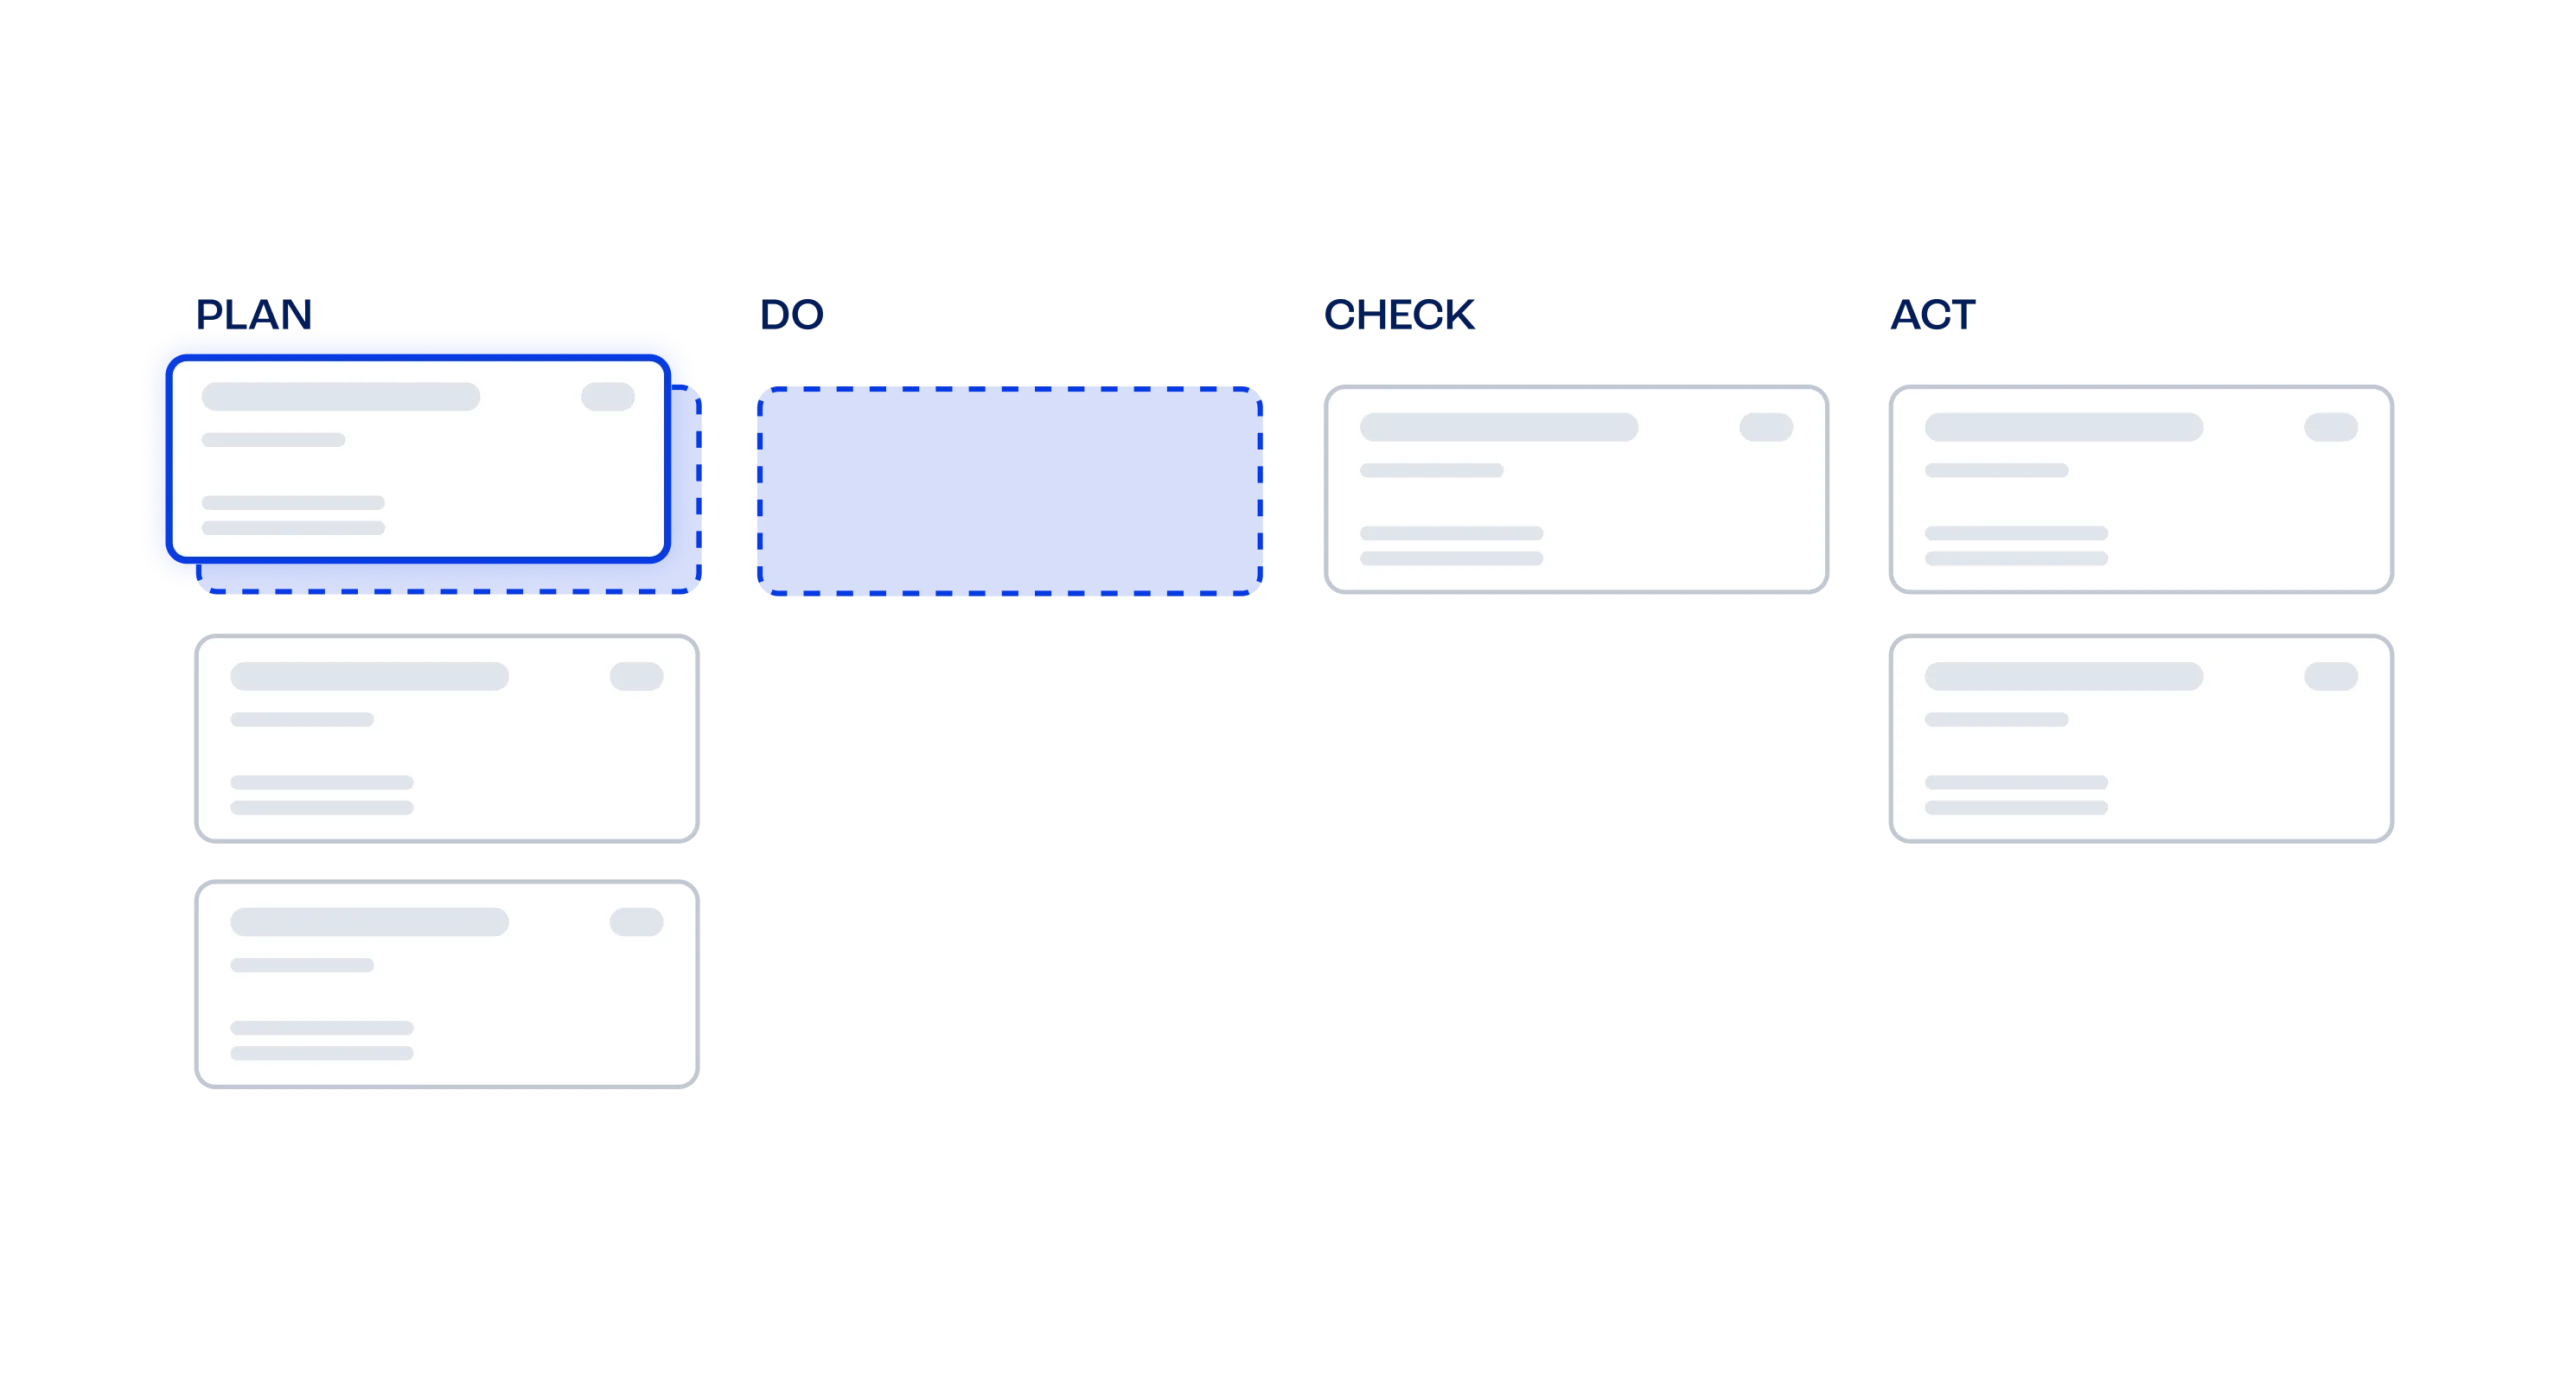
PDCA project management
Create tasks and track the effectiveness of continuous improvements. Manage plan execution and production backlogs through the integrated PDCA project management dashboard.
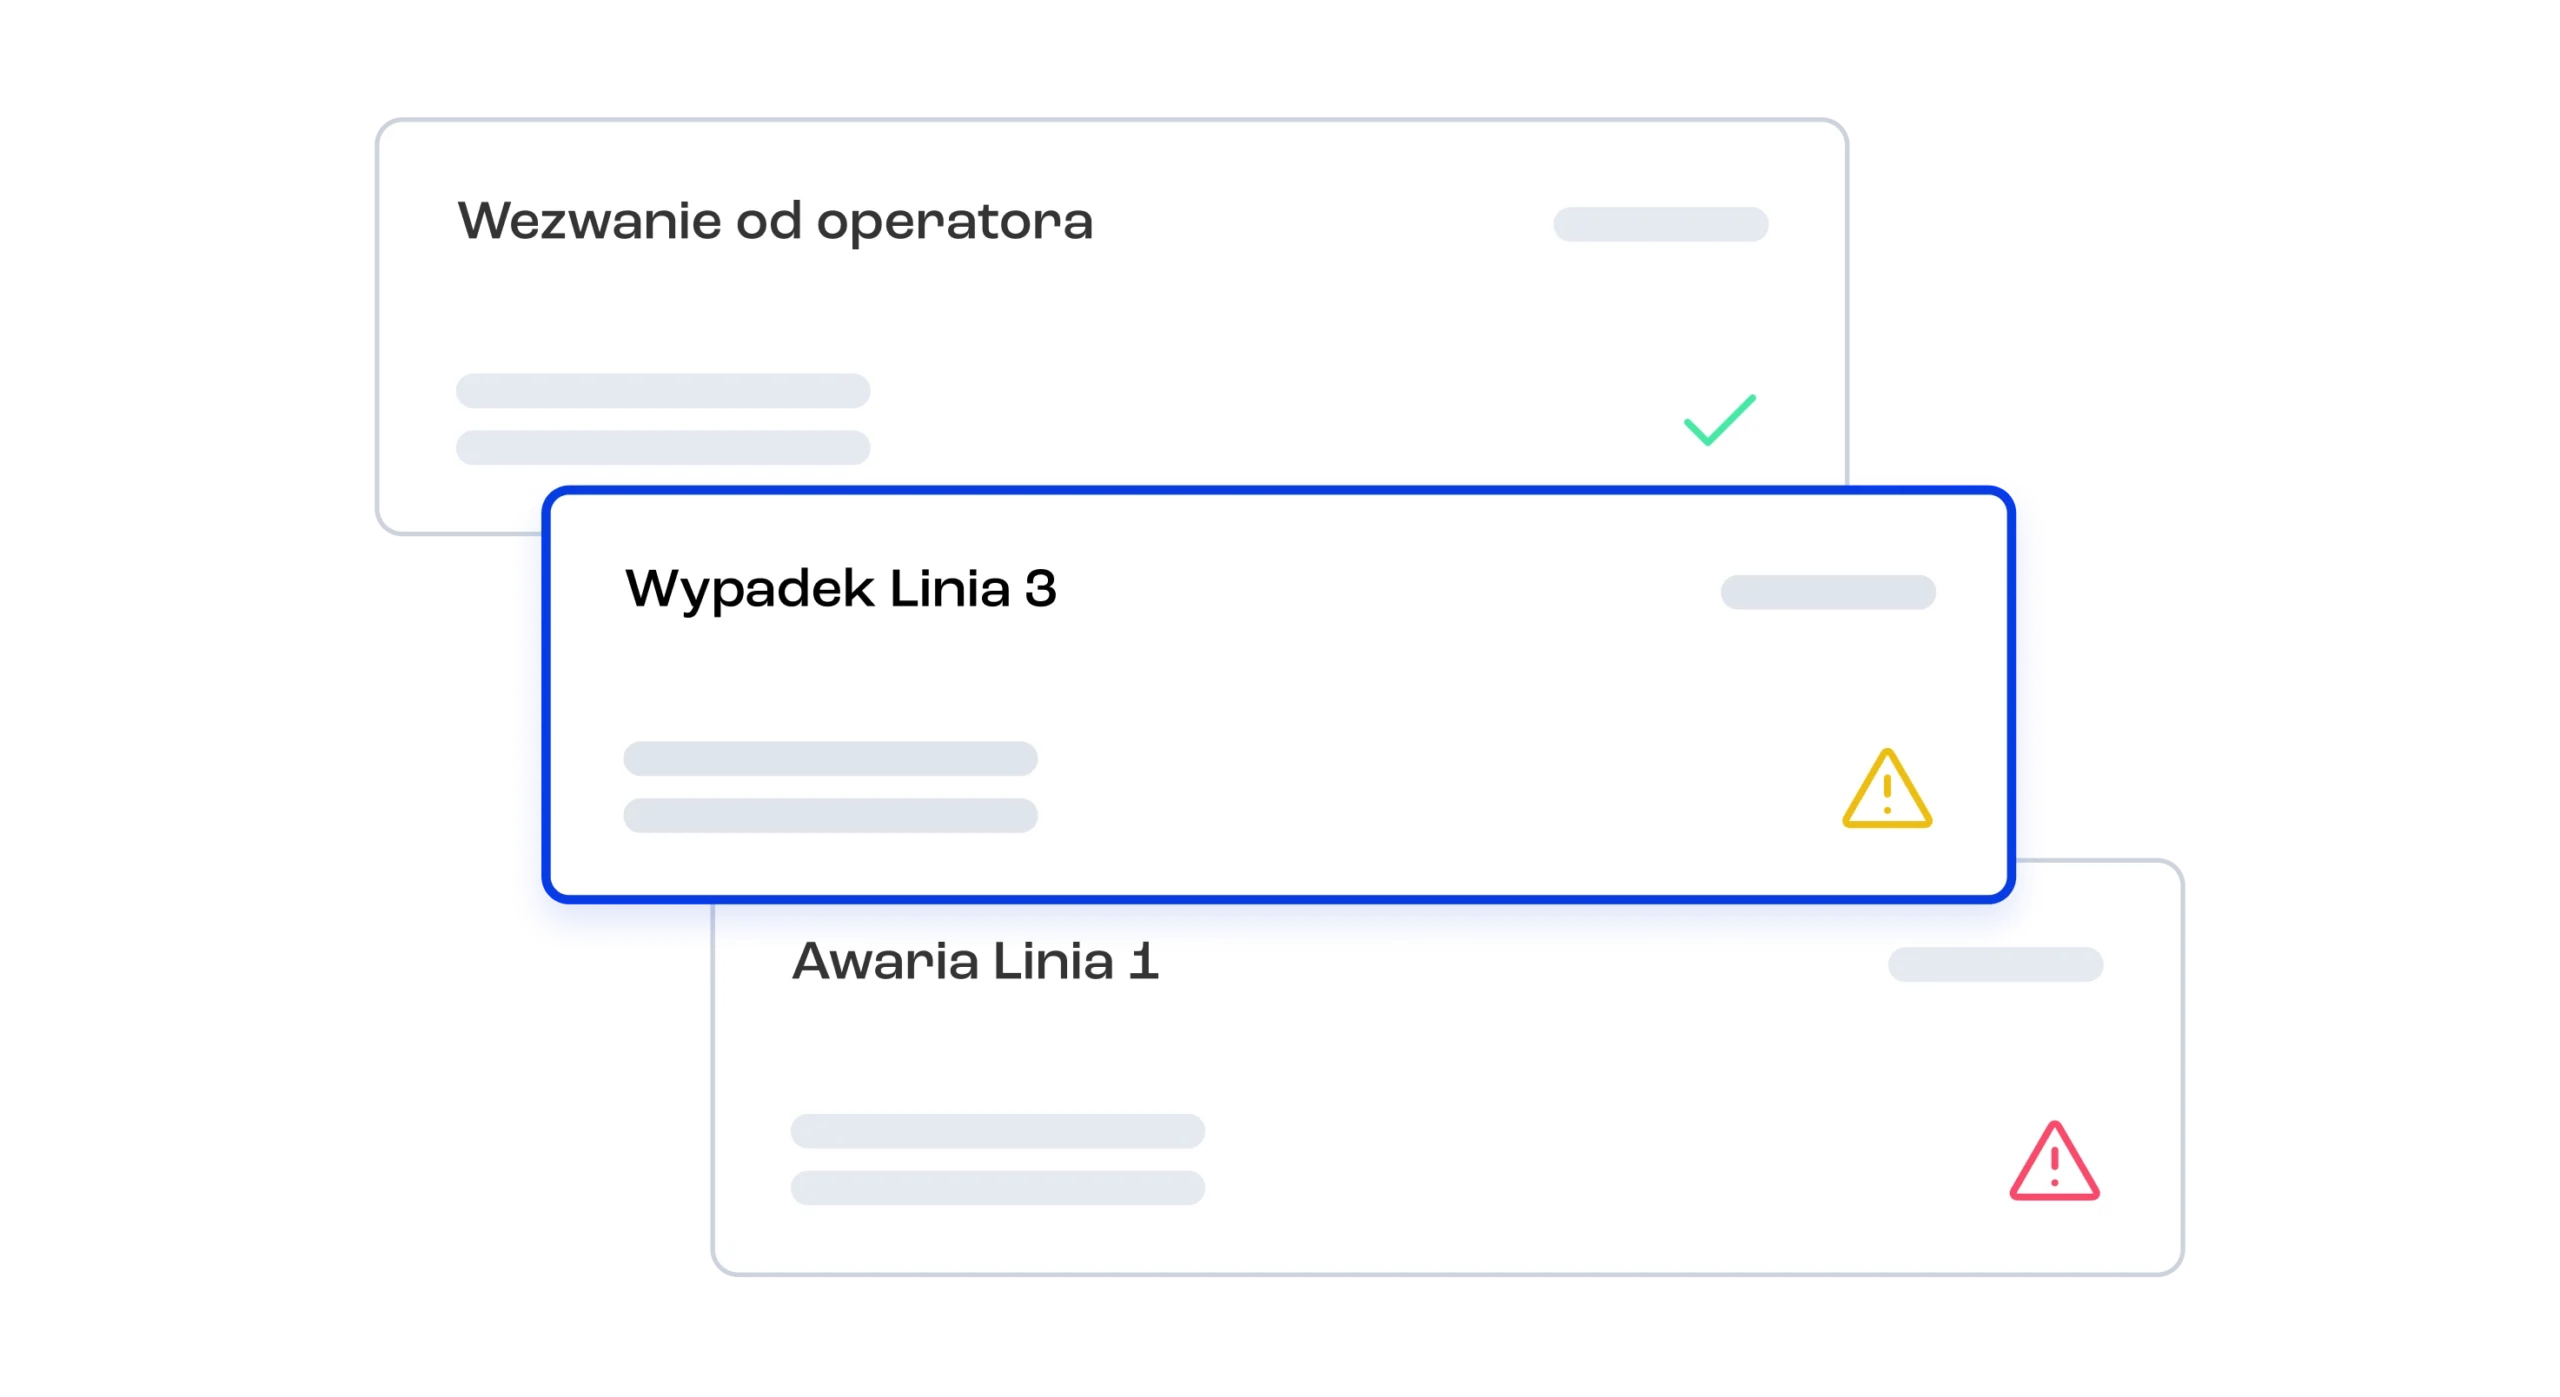
Smart Notification System
Receive instant notifications for critical events: equipment breakdowns, safety incidents, and operator assistance requests. Access the precise information you need to maintain line control and optimize operations.
Access to files
Access all essential documentation from your dashboard. View work instructions, quality reports, and procedures. Upload, distribute, and track document acknowledgment through electronic signatures.

Charts and statistics
Kanri processes all collected data and presents it through intuitive, real-time charts and analytics:
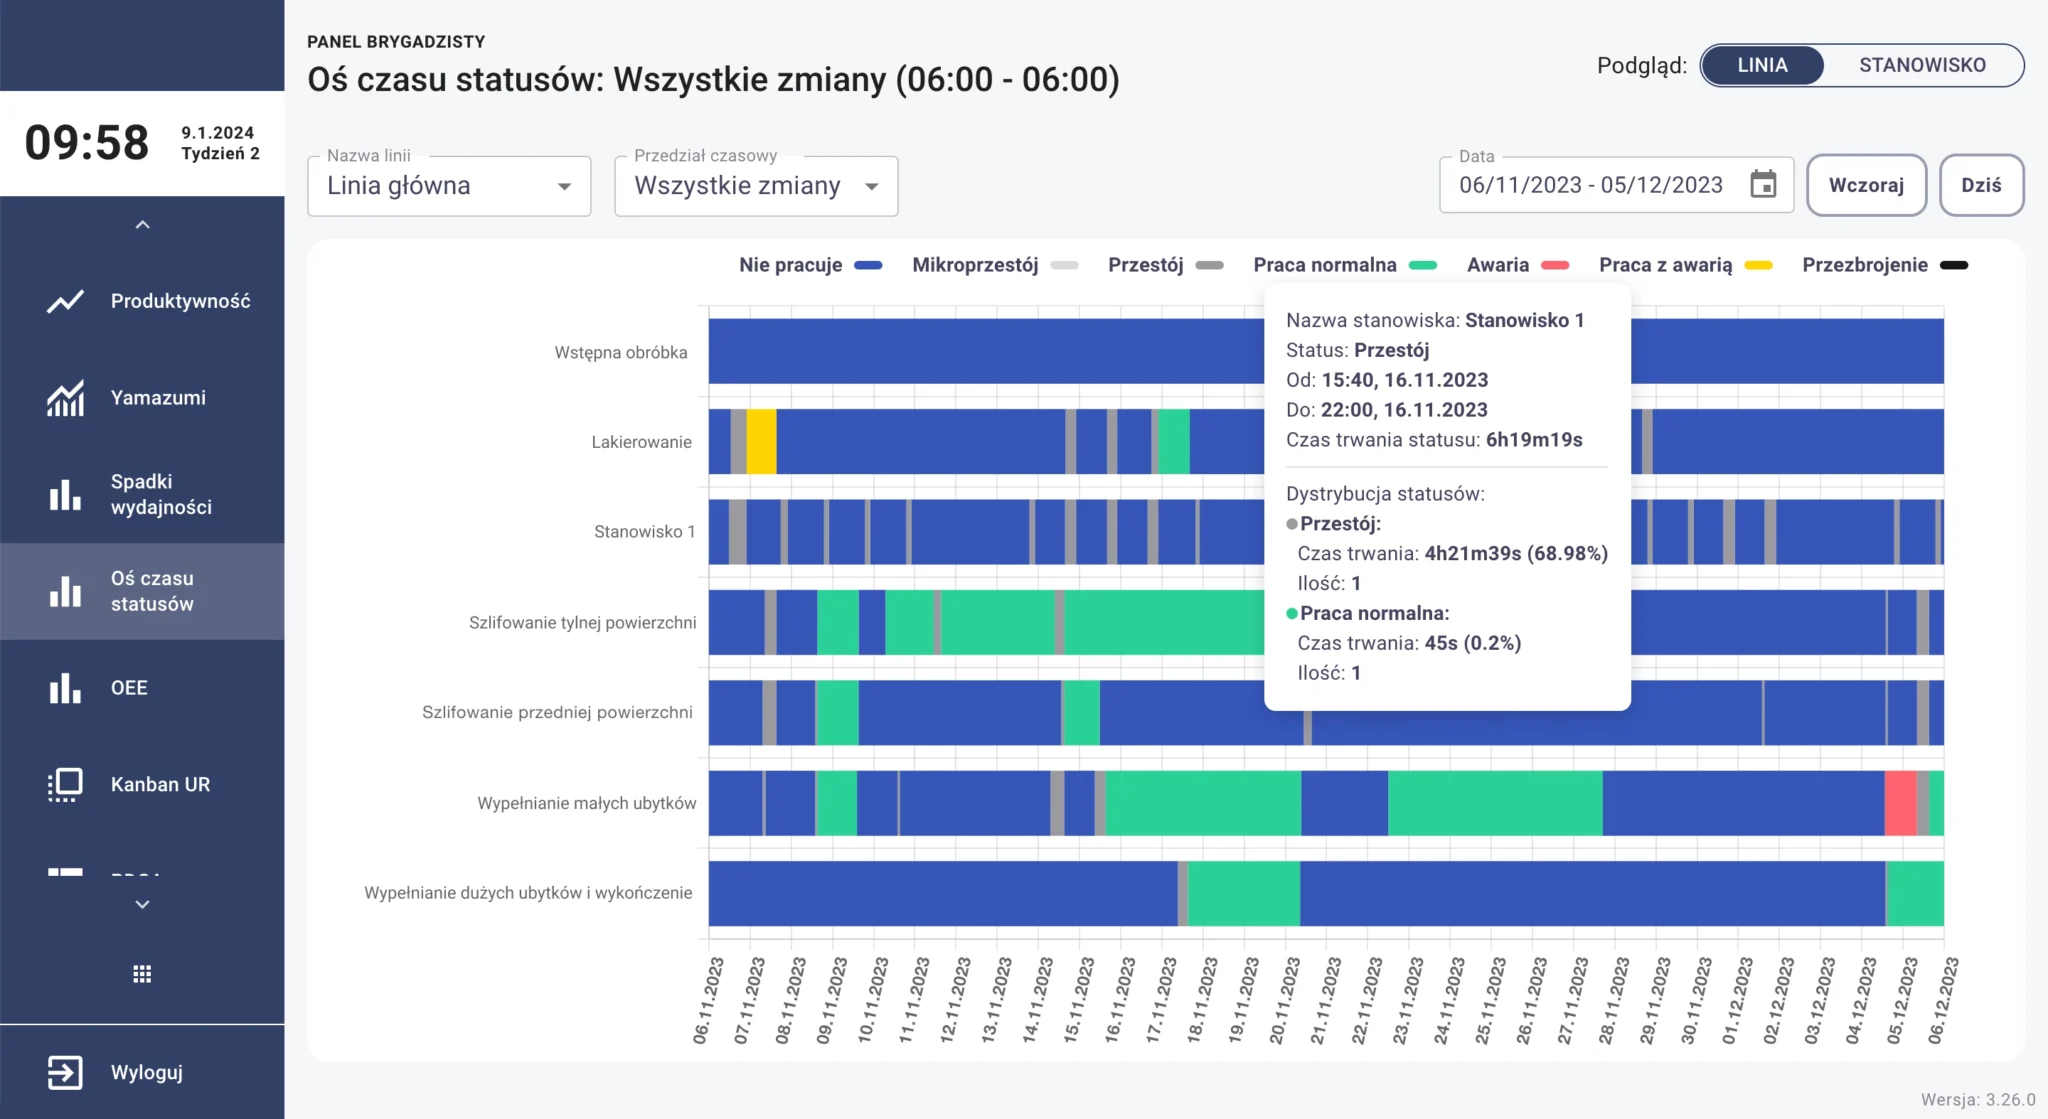
STATUS TIMELINE
Track machine status changes across selected lines or stations, enabling you to analyze equipment operating history and downtime patterns.
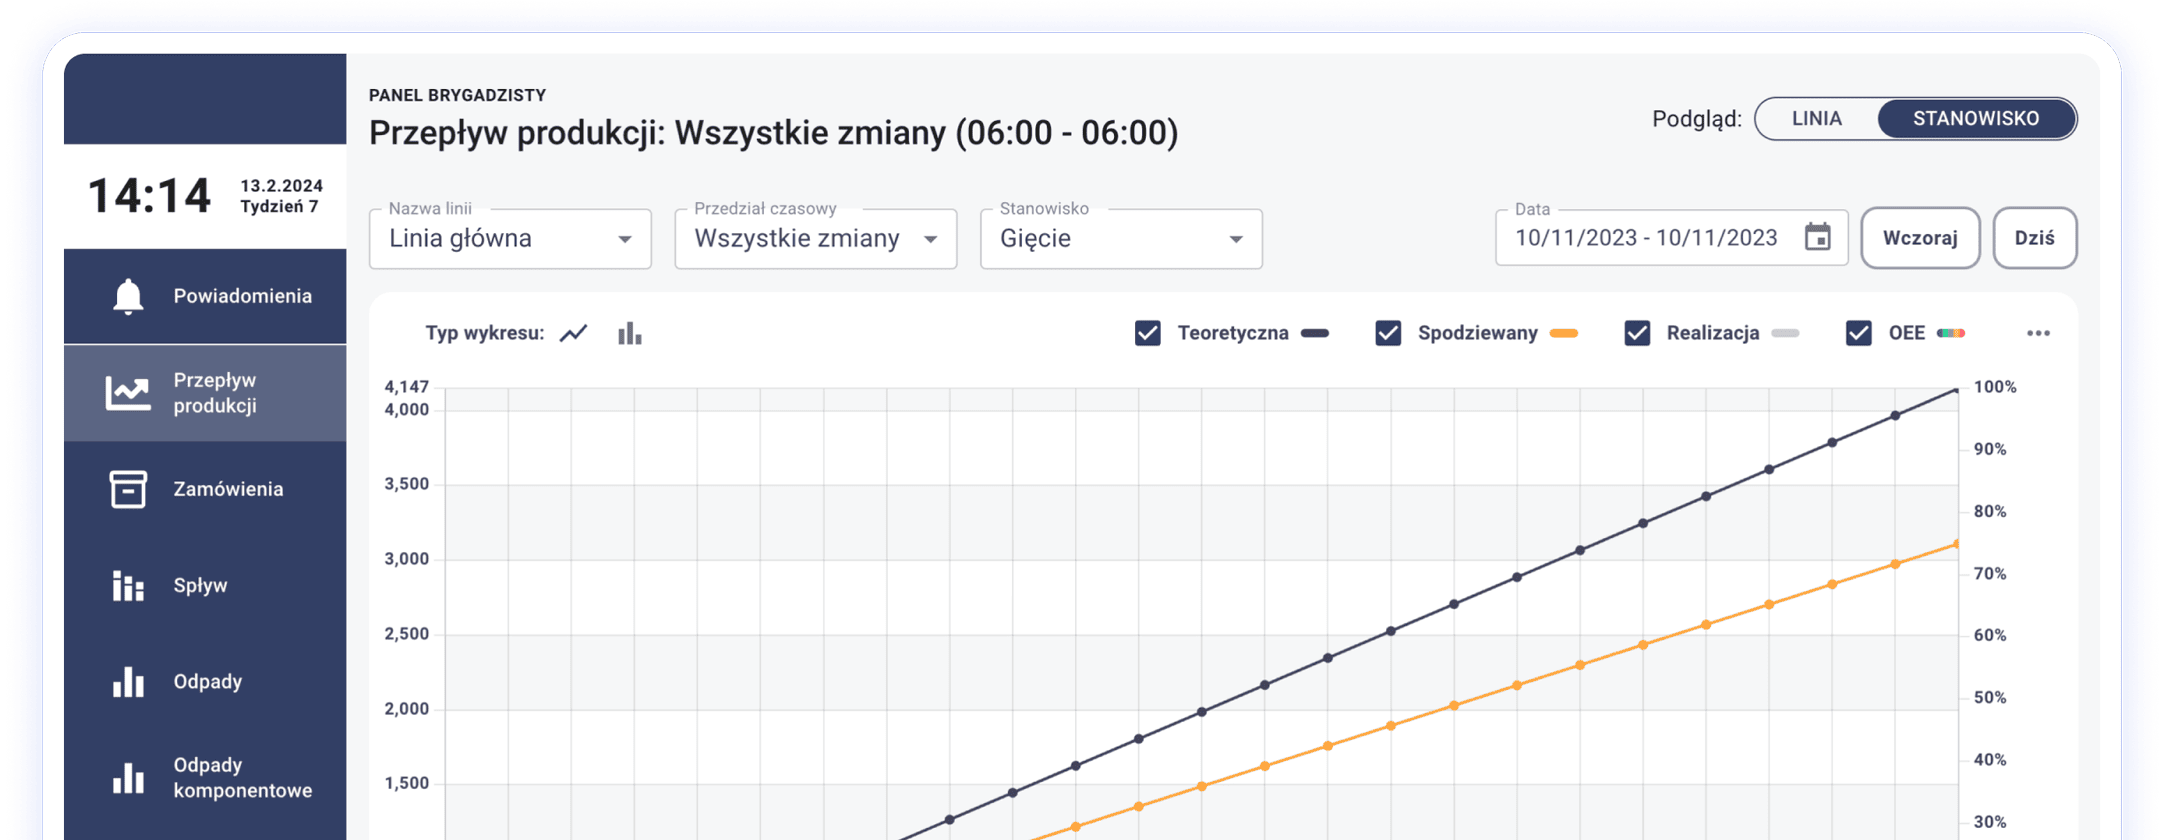
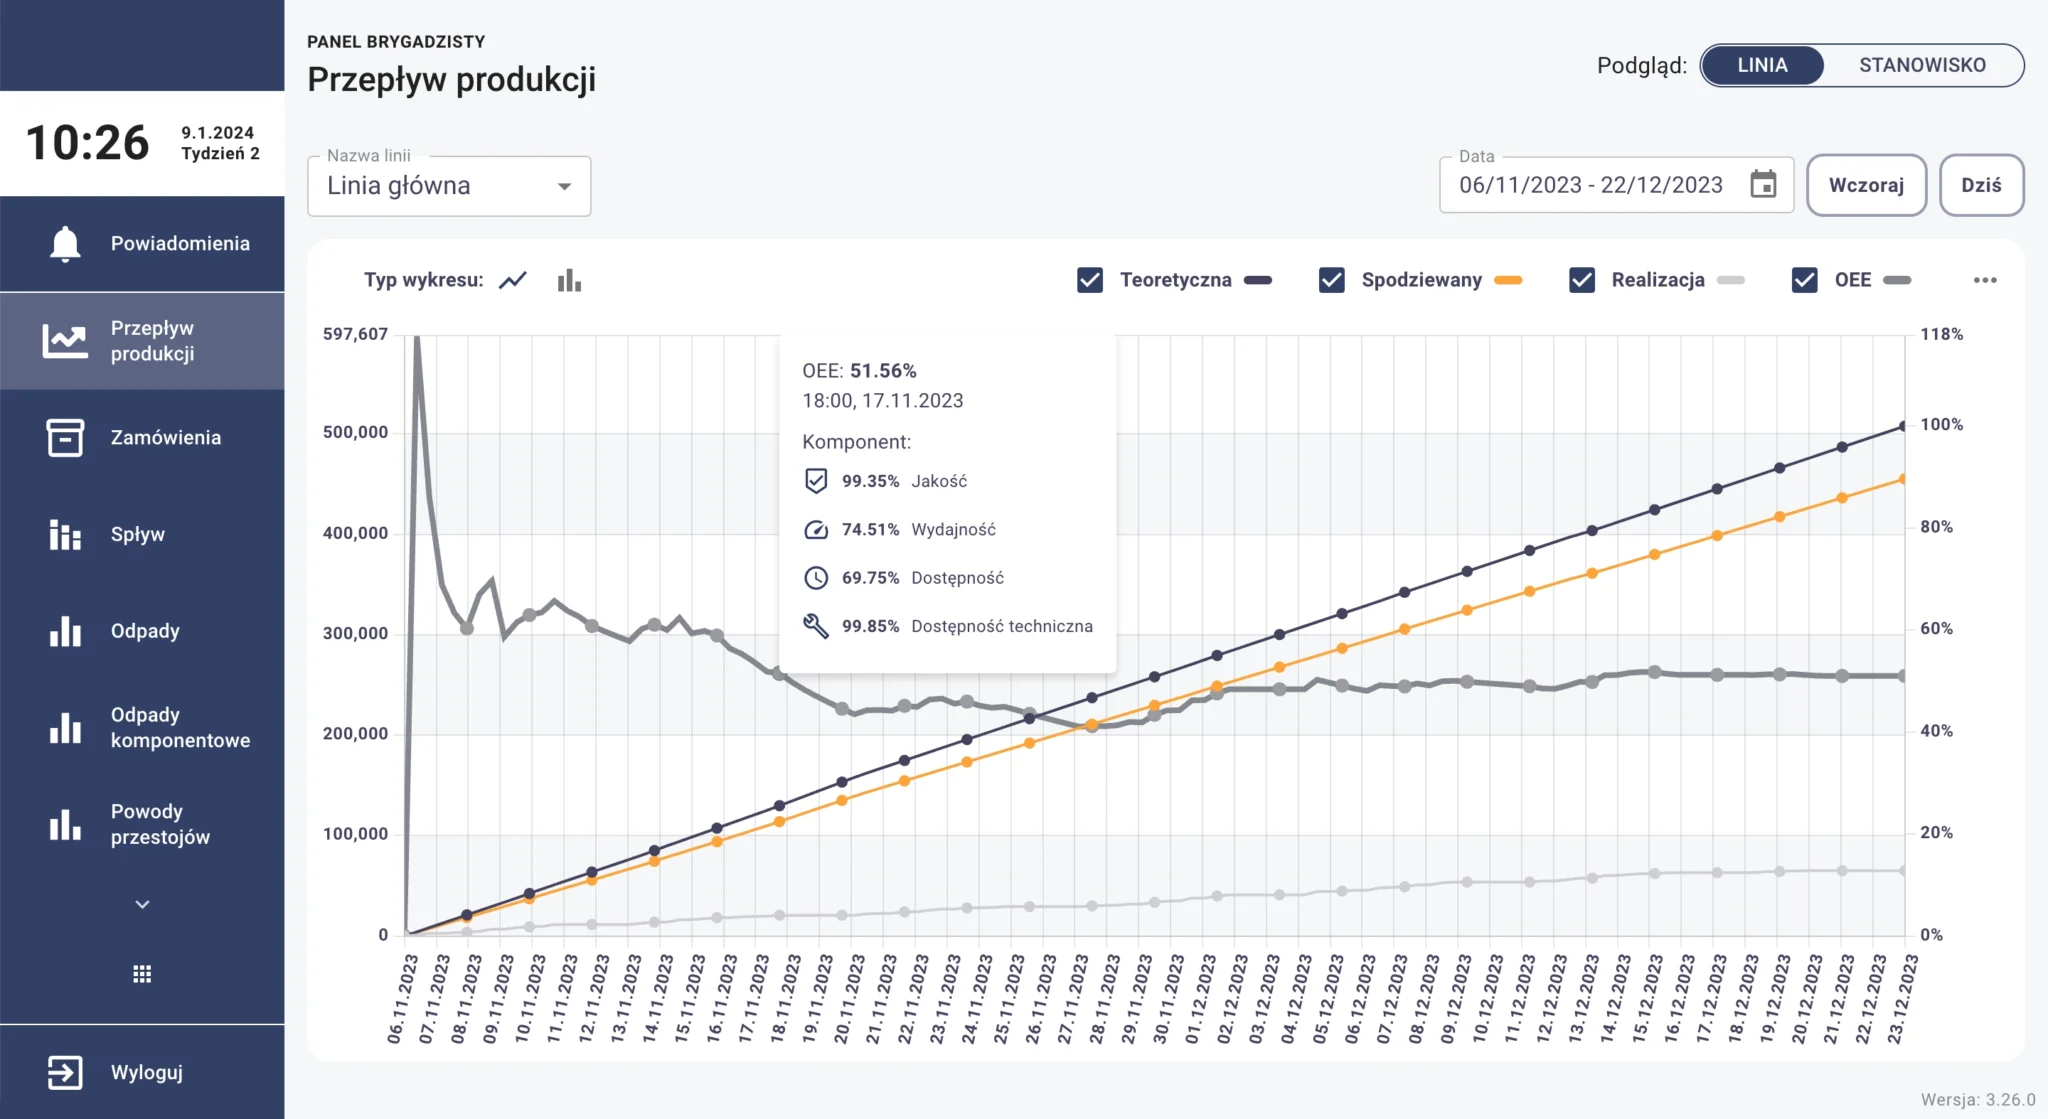
PRODUCTION FLOW
Monitor production progress across lines and stations, comparing planned versus actual execution in real-time.
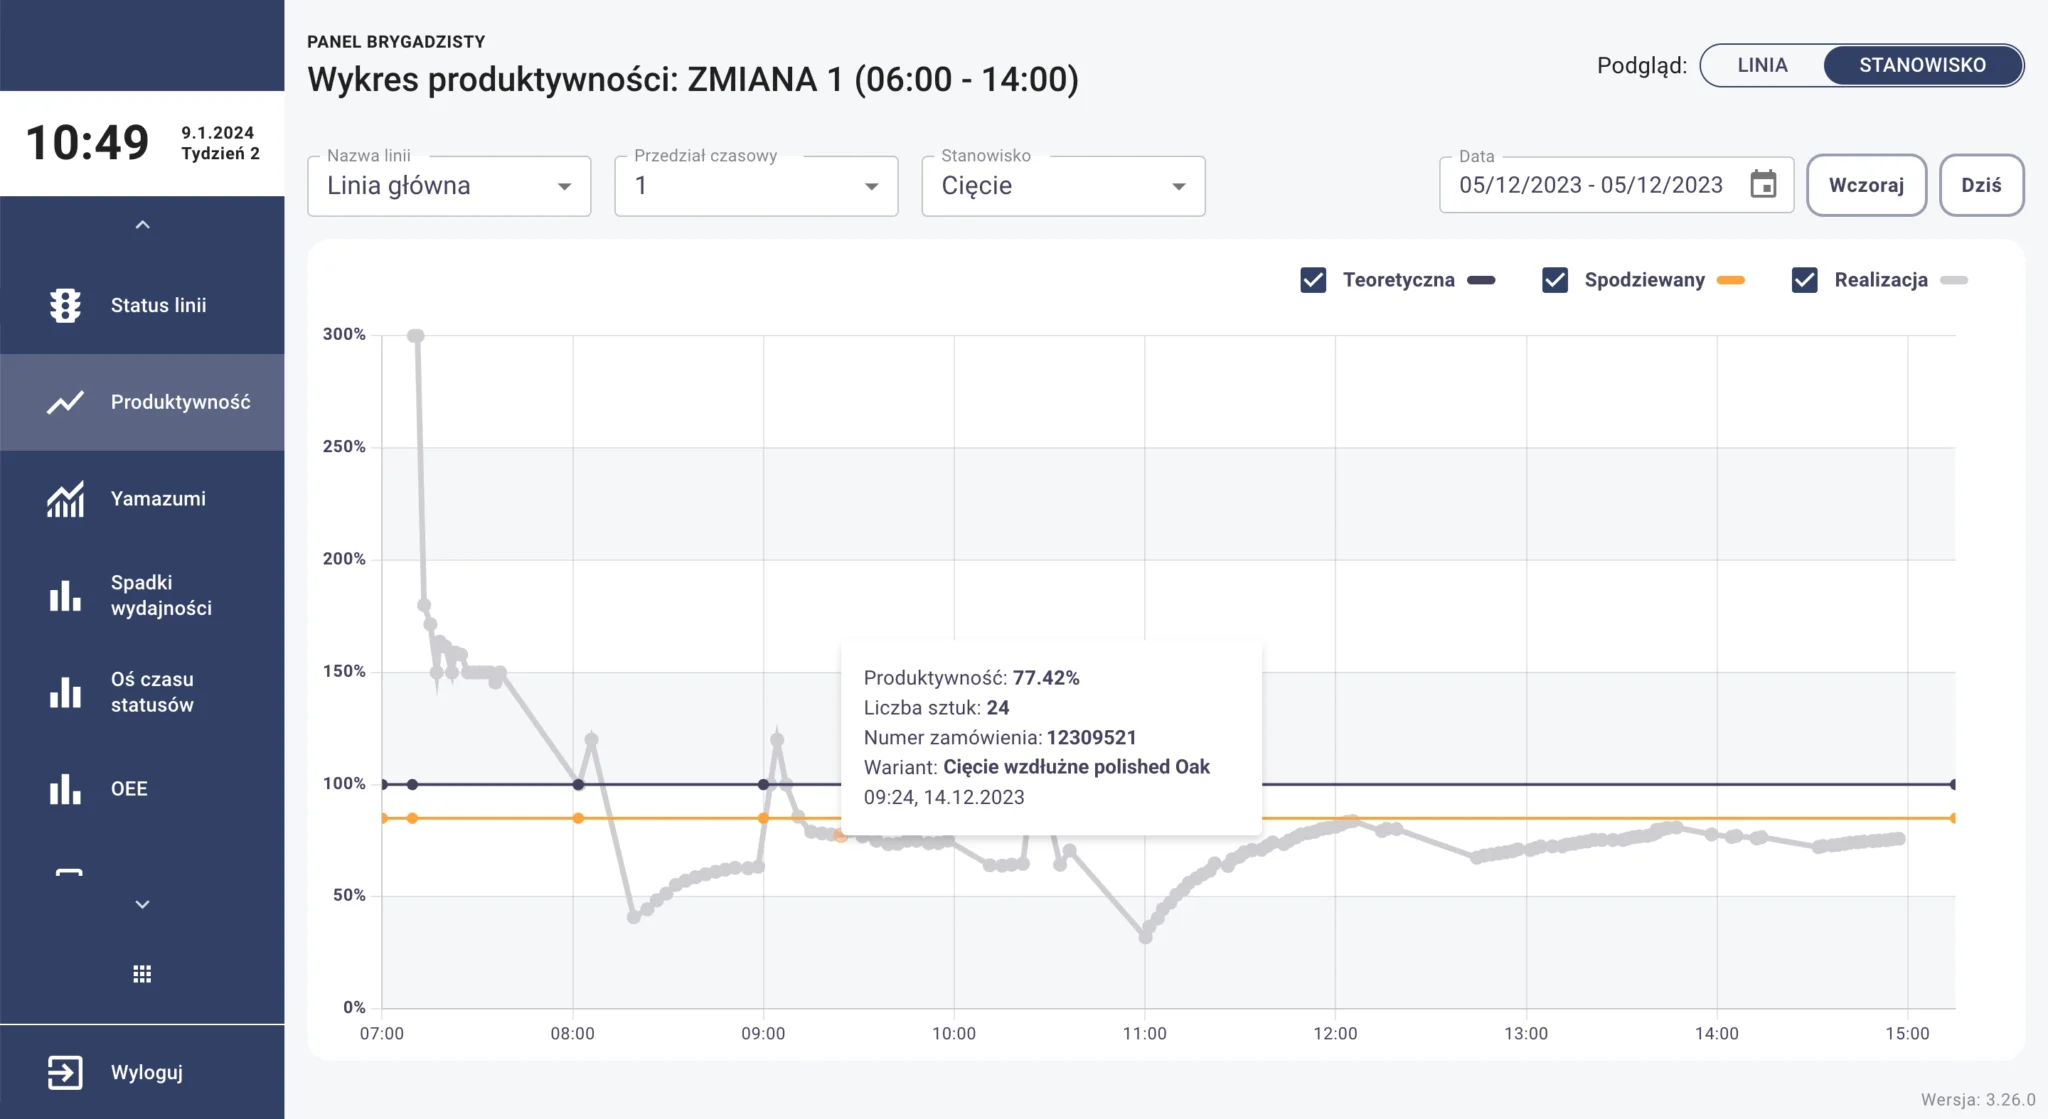
PRODUCTIVITY
Evaluate individual station and line performance by comparing target production rates with actual output speeds.
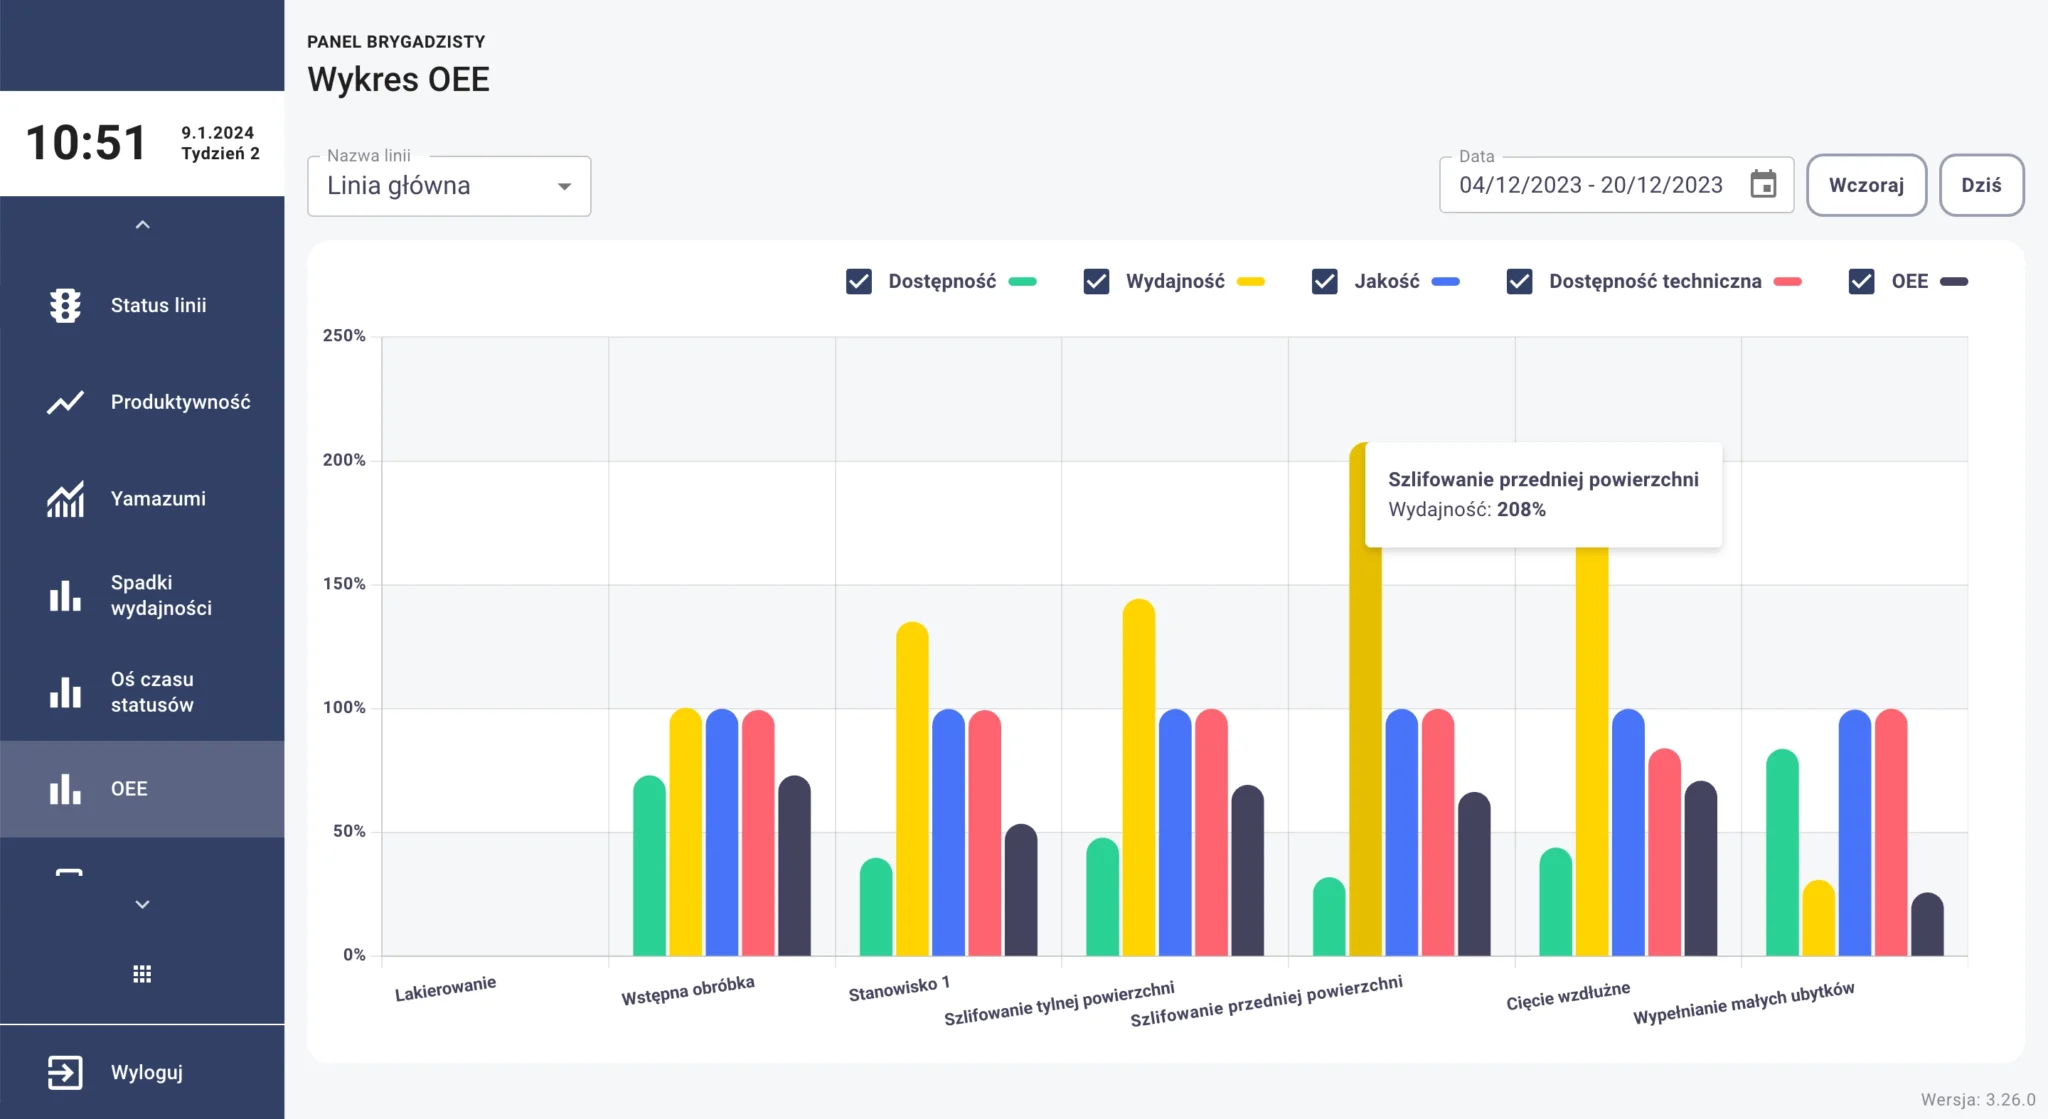
OEE
Compare OEE values across lines or stations over selected time periods, with metrics based on availability, performance, and quality.
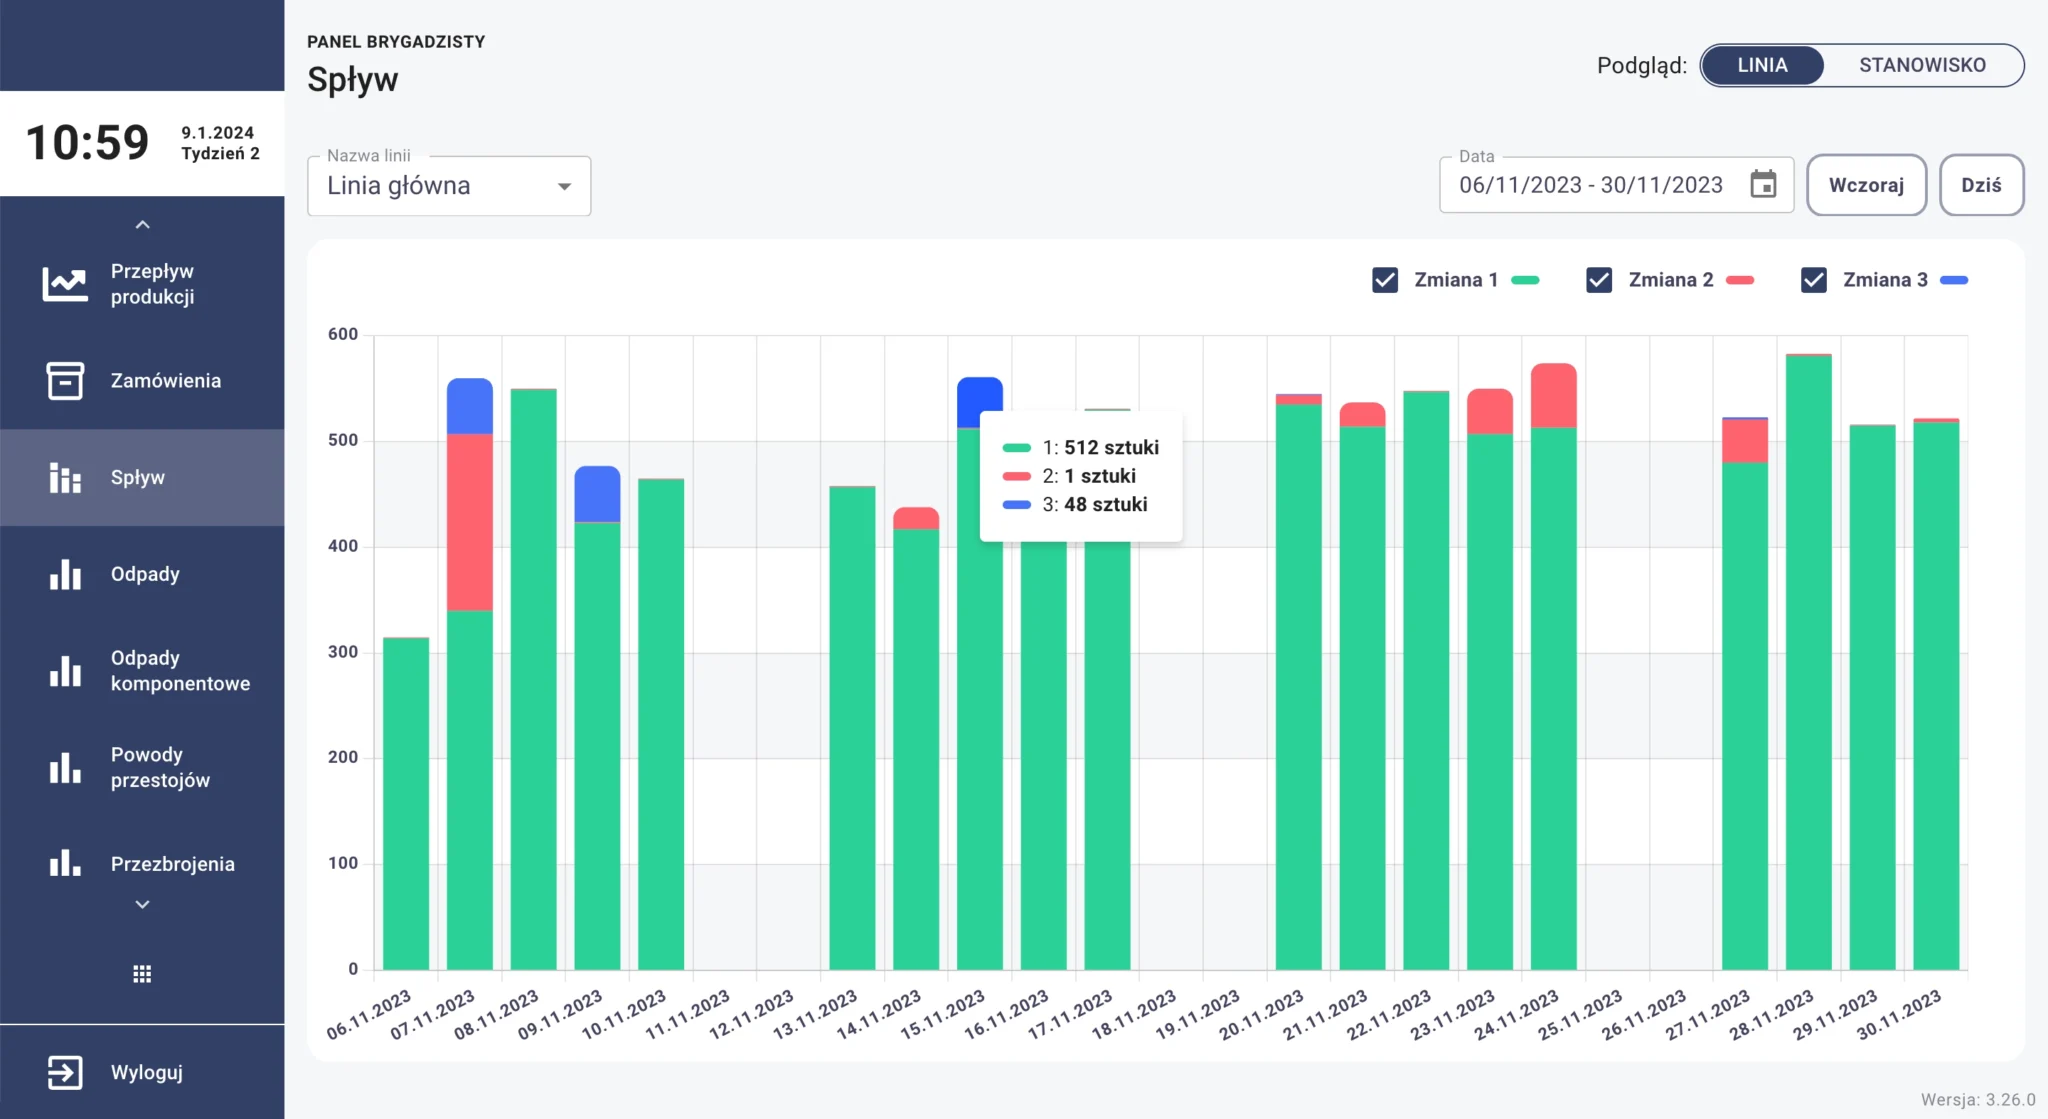
FLOW
View production output by shift or specific date ranges for any production line.
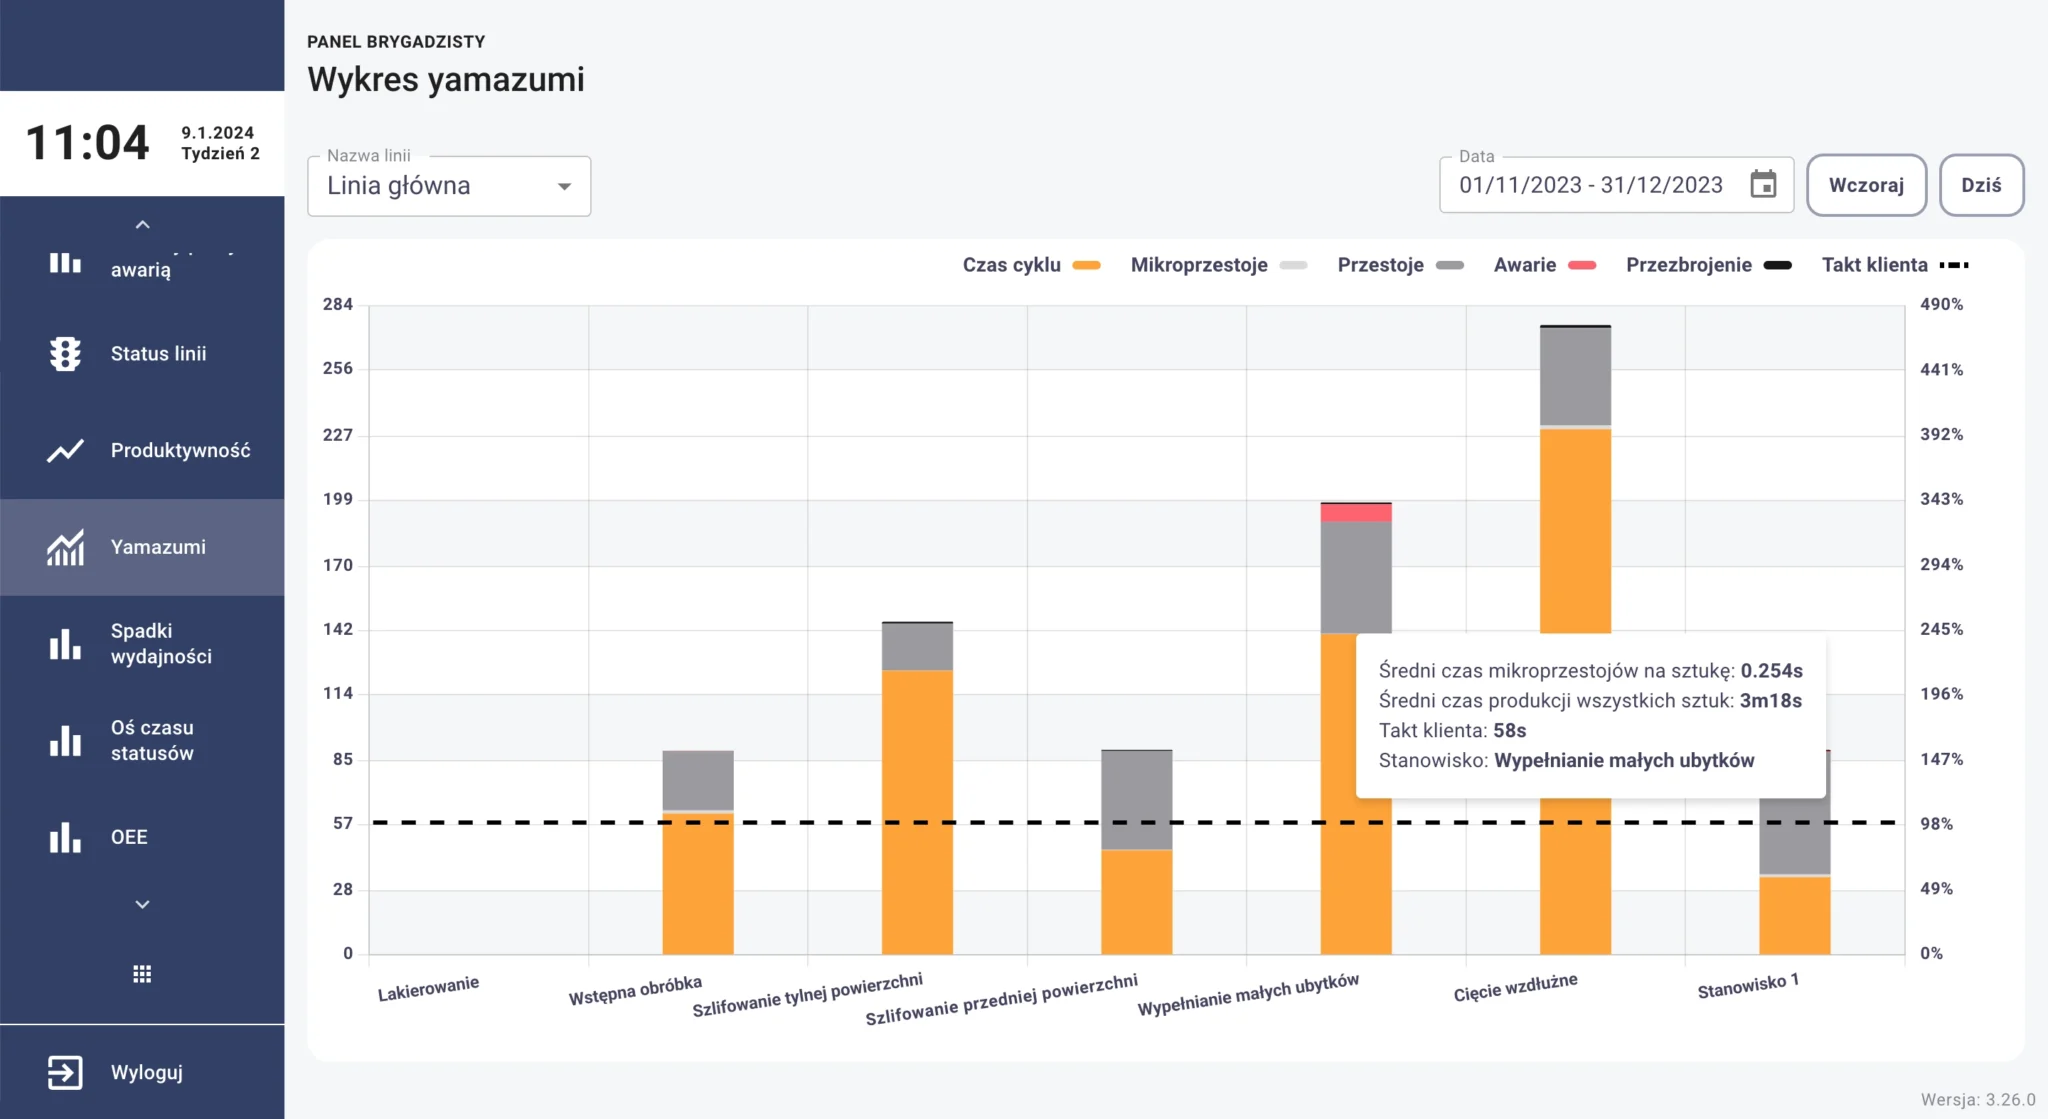
YAMAZUMI
Compare actual cycle times at each station against target timing to identify bottlenecks and balance opportunities.
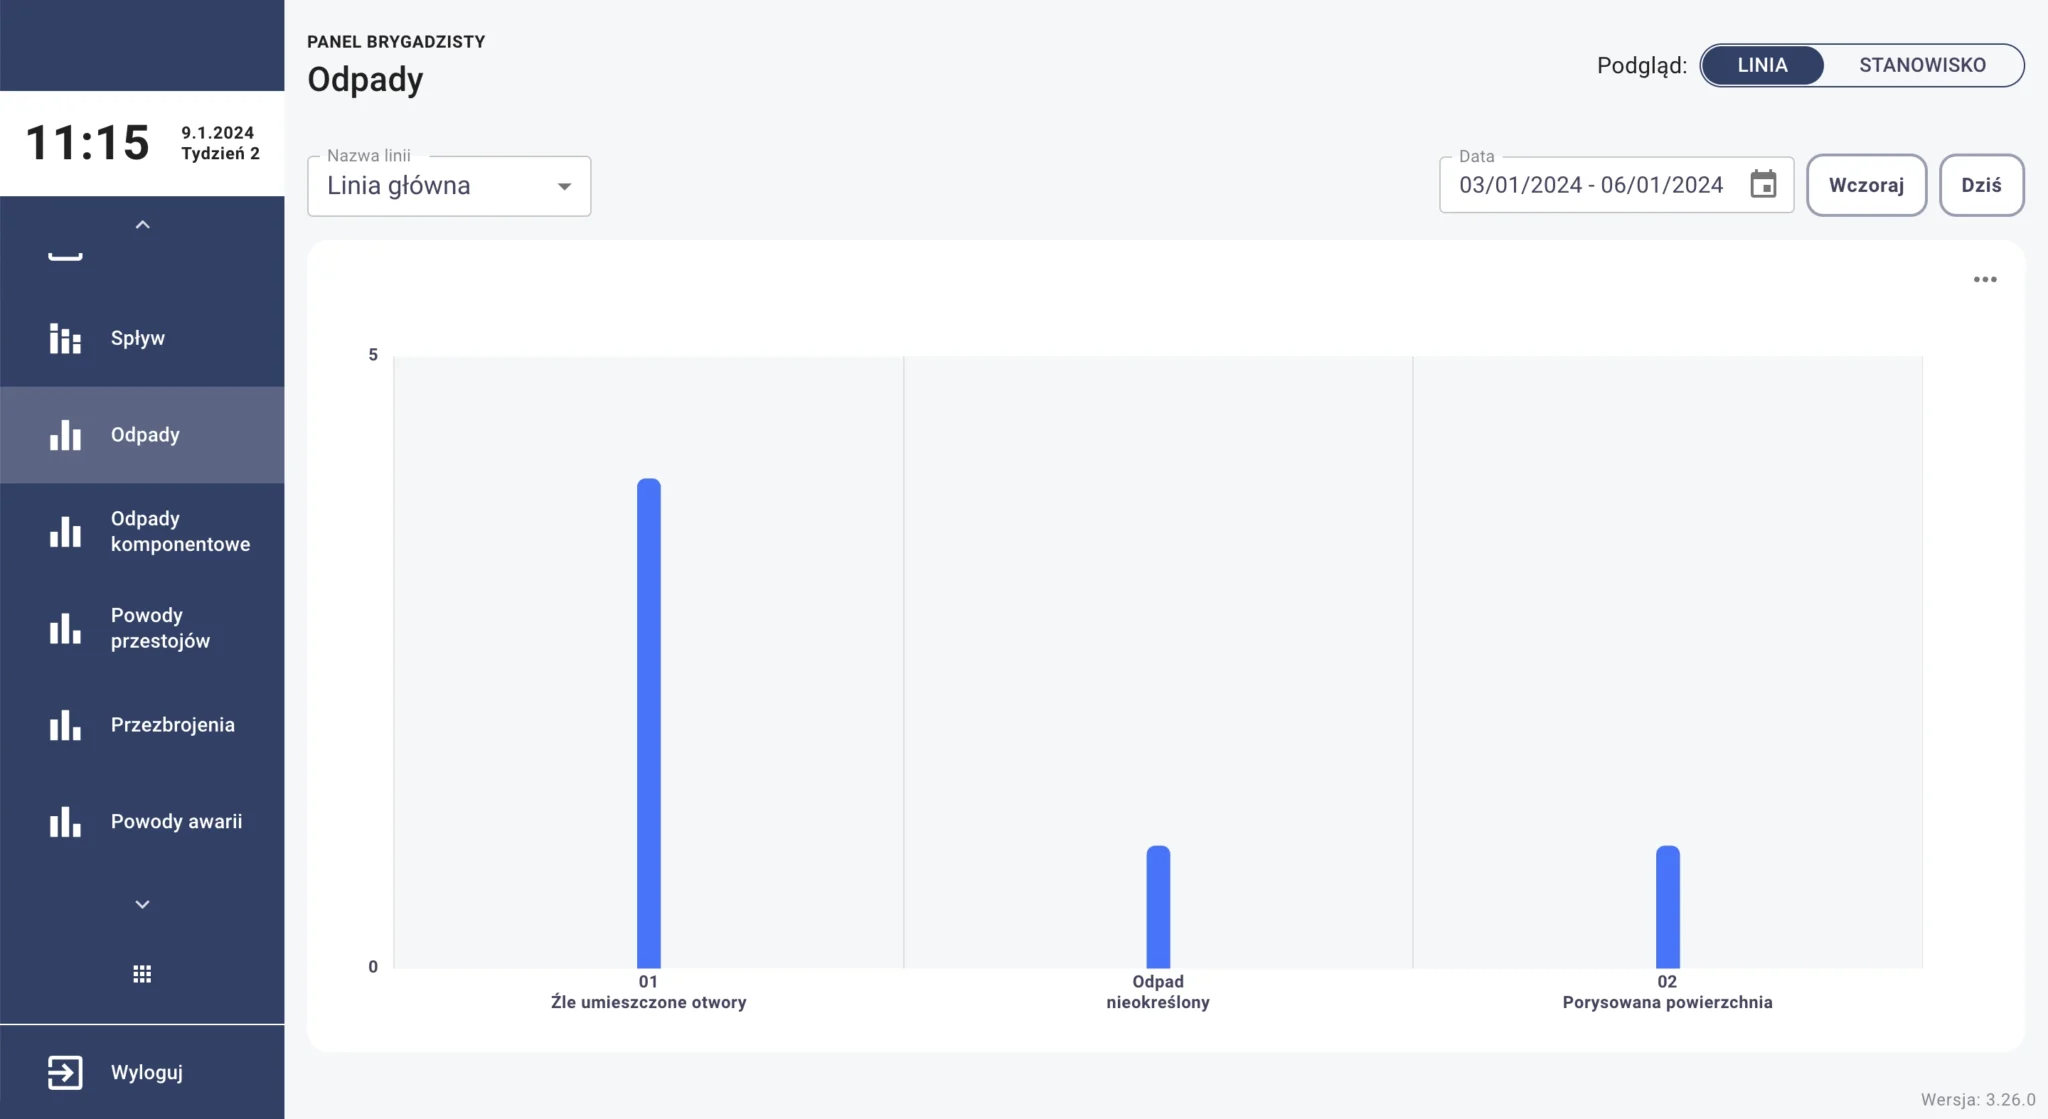
WASTE
Analyze quality issues by line or station using operator-reported defect data and error categorization.
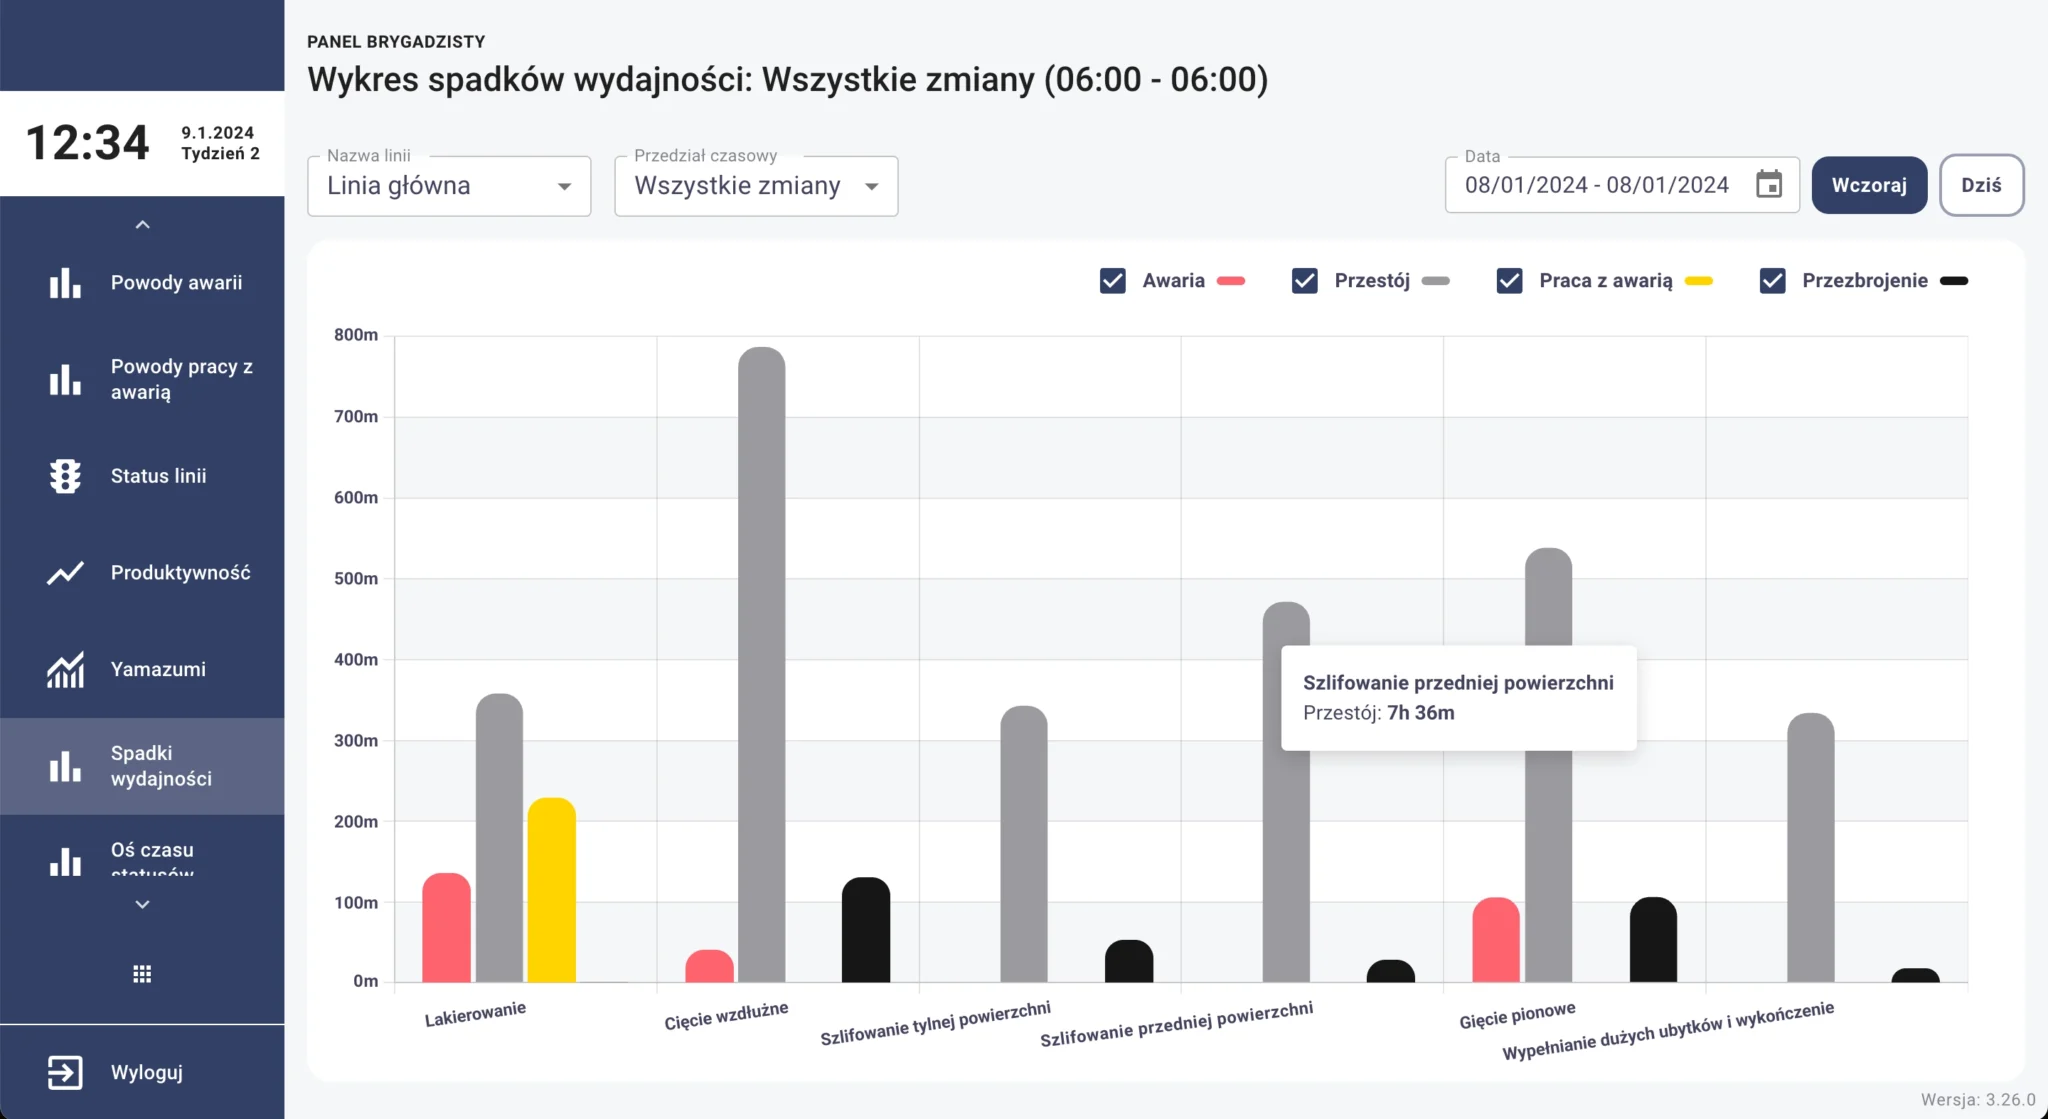
PERFORMANCE DROPS
Identify root causes of productivity losses including equipment failures, unplanned downtime, and changeover inefficiencies.
Charts and statistics
Kanri processes all collected data and presents it through intuitive, real-time charts and analytics:
STATUS TIMELINE
Track machine status changes across selected lines or stations, enabling you to analyze equipment operating history and downtime patterns.
PRODUCTION FLOW
Monitor production progress across lines and stations, comparing planned versus actual execution in real-time.
PRODUCTIVITY
Evaluate individual station and line performance by comparing target production rates with actual output speeds.
OEE
Compare OEE values across lines or stations over selected time periods, with metrics based on availability, performance, and quality.
FLOW
View production output by shift or specific date ranges for any production line.
YAMAZUMI
Compare actual cycle times at each station against target timing to identify bottlenecks and balance opportunities.
WASTE
Analyze quality issues by line or station using operator-reported defect data and error categorization.
PERFORMANCE DROPS
Identify root causes of productivity losses including equipment failures, unplanned downtime, and changeover inefficiencies.
Collecting huge amounts of data only makes sense if we can make use of it.

See the big picture
Manufacturing facilities often rely on multiple data collection systems that aren't compatible, requiring time-consuming manual collection and comparison. Here's how Kanri transforms your data strategy:

Data consistency
Kanri captures process data directly from equipment and operators, eliminating human error while delivering precise, analysis-ready information.

Visualization and accessibility
Intuitive visualizations give managers complete visibility into production processes and any irregularities. Operators access real-time information relevant to their current work orders and responsibilities.

Maximize production efficiency
Reliable and real-time charts and data allow you to identify areas for improvement, understand the causes of inefficiency and optimize production. You make decisions instantly, based on reliable data.
Explore all the functionalities of Kanri
Learn about the benefits of Kanri for employees at every level in a manufacturing plant.
Be part of the change
Schedule a 60-minute consultation where we'll assess your specific needs and demonstrate how Kanri addresses your production challenges.
Request a demo - no obligation